

Introduction
In May 2022, Unity Software told investors that bad data had hurt its business. The company said it had ingested bad data from a large customer, which cost it the value of part of the training data behind its ad-targeting tool. Unity estimated the impact of this problem and a related platform fault at about $110 million in 2022.
So, what is data integration, and why can one bad feed cost a public company so much? Data integration pulls data out of separate systems and combines it into one cleaned view a business can trust. Done well, it catches problems like Unity’s before they reach a report or a model.
This article explains how data integration works, the main types and when to use each, and real examples from sales, marketing, and e-commerce teams.
What Is Data Integration?
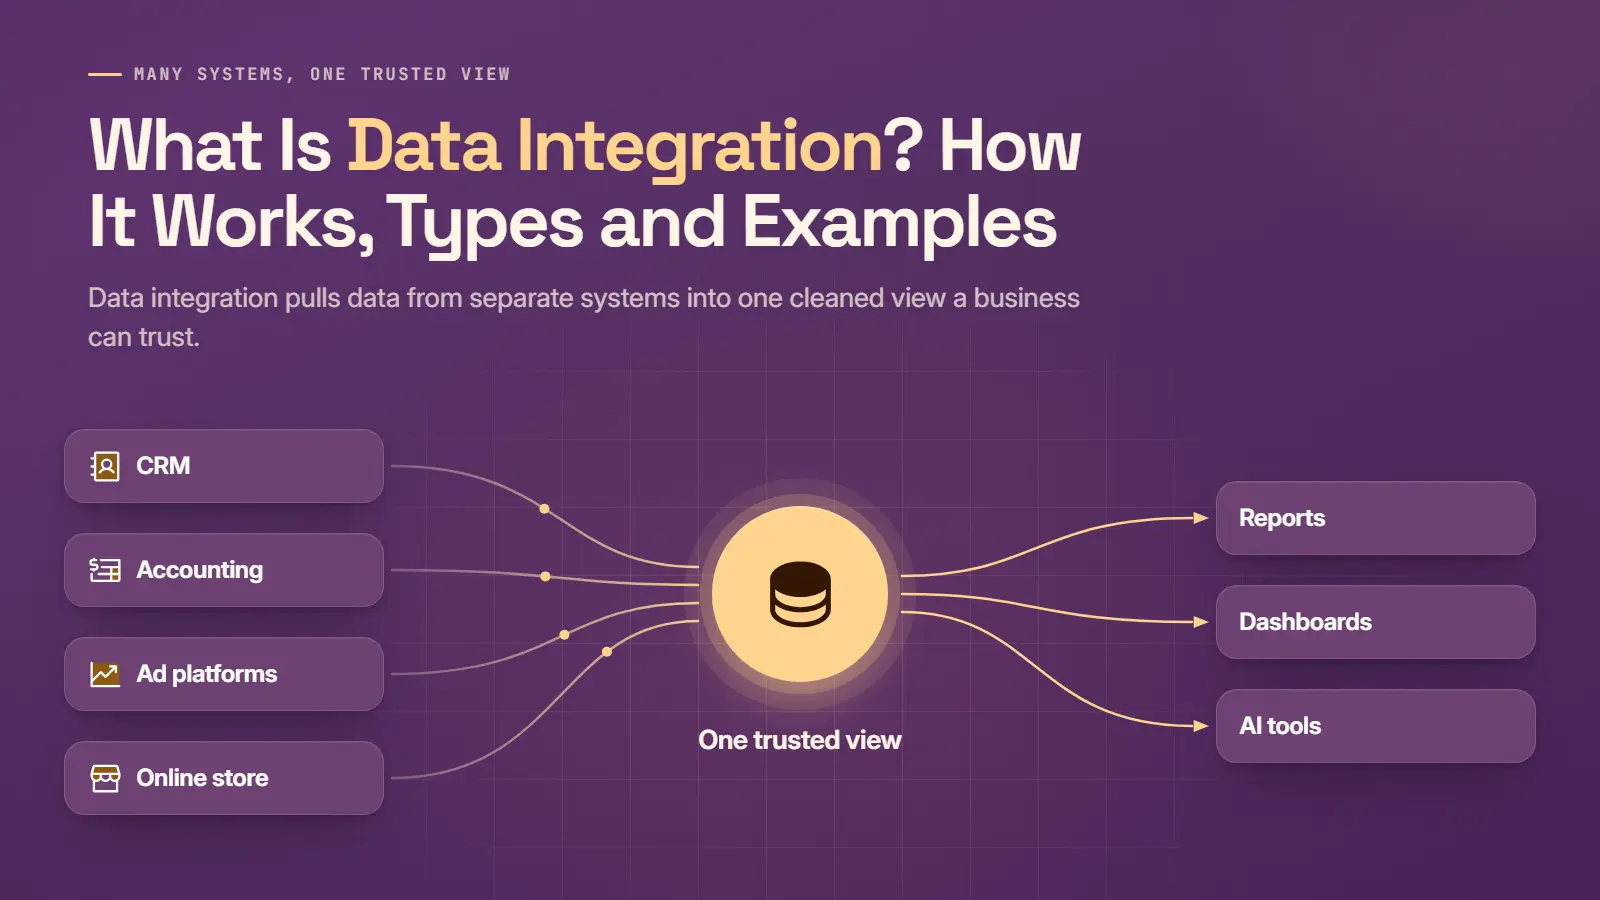
Data integration is the process of combining data from separate systems, such as a CRM, an accounting tool, and ad platforms, into one consistent view. The process pulls records from each source and standardizes their formats. It then loads the result into a central store, so reports, dashboards, and AI tools read from one place instead of many.
For a sales or finance leader, the data integration meaning shows up in meetings. Before integration, sales quotes revenue from the CRM while finance quotes another figure from the accounting system. After integration, both figures come from the same table, built with the same rules. The data engineering behind this stays invisible to the people who use it.
Why Data Integration Matters for a Growing Business
Data integration matters because most companies now run far more software than they connect. MuleSoft’s connectivity benchmark found that organizations use 897 applications on average, while only 29% of those applications are connected. Each unconnected tool keeps its own version of customers, orders, and revenue. A growing business feels this gap in three places.

One Version of Each Number
Integration gives every team one version of each number, because every report reads from the same cleaned data. Without it, trust erodes. Research from Precisely and Drexel University found that 67% of organizations don’t completely trust the data behind their decisions, up from 55% in 2023.
Less Manual Reporting
Integration cuts manual reporting, since pipelines collect data on a schedule instead of people copying it by hand. Lost and Found Marketing, a roofing-focused marketing agency, had data spread across CRMs, ad platforms, and call-tracking tools. Data Prism unified more than 15 of these platforms into one reporting platform. As a result, its dashboards now refresh without manual data gathering.
Faster Decisions
Integrated data speeds up decisions, because the answer already exists when someone asks the question. A sales leader can check pipeline against booked revenue on Monday morning instead of waiting for a month-end export. Most of the gain comes from skipping the wait for someone to merge files.
How Data Integration Works
Data integration works in four steps that move data from source systems to the people who use it. Each step usually runs inside automated data pipelines on a schedule or in real time. The first two steps prepare the data, while the last two make it usable.

Extract Data From Source Systems
Extraction copies data out of each source system through an API, a database connection, or a file export. The copying is rarely the hard part. Teams often find that nobody can explain how a system’s tables fit together, especially when the person who set it up has left. So, mapping every source, its owner, and its main fields comes first.
Transform and Standardize It
Transformation cleans and standardizes the extracted data so records from different systems line up. Typical work removes duplicates and fixes date and currency formats. It also matches the same customer across the CRM and the billing system. Good data management keeps the business rules behind these fixes documented and owned.
Load It Into a Central Store
Loading writes the cleaned data into a central store, usually a cloud data warehouse such as Snowflake, BigQuery, or Redshift. Some teams also keep raw files in a data lake for later use. Either way, the store has to handle volume as the business grows.
Volume is where a weak store shows first. Scout, a real estate intelligence company, kept more than 200 million consumer records in PostgreSQL, and processing took 84 hours. After Data Prism moved the platform to Snowflake, processing took 2 hours. Monthly infrastructure cost also fell from about $4,000 to $40.
Serve It to Reports, Apps and AI
Serving makes the integrated data available to the tools people already use. Dashboards in Power BI or Looker Studio read from the warehouse. AI models need the same clean, joined data, since a model trained on bad records repeats their errors.
The same four steps apply in cloud integration setups, where every source and the central store run online.
The Main Types of Data Integration
The main types of data integration differ mostly in timing and in whether data is copied at all. Batch methods move data on a schedule, while streaming methods move each change as it happens. Virtualization skips the copy entirely. The table compares the five data integration methods covered below. A separate guide walks through all eight integration techniques and when to use each one.
|
Method |
How Data Moves |
Freshness |
Best For |
Example Tools |
|---|---|---|---|---|
|
ETL |
Transformed, then loaded |
Hours to daily |
Strict rules before data lands |
Informatica, SSIS |
|
ELT |
Loaded raw, transformed in the warehouse |
Minutes to hours |
Cloud warehouses with many sources |
Fivetran, Airbyte, dbt |
|
CDC and Replication |
Only changed rows copied |
Seconds to minutes |
Large, busy databases |
Debezium, Kafka |
|
API-Based |
Requested from each app’s API |
Near real time |
SaaS apps and live syncs |
Vendor APIs, custom code |
|
Data Virtualization |
Queried in place, never copied |
Live |
Quick access without a warehouse |
Denodo |
As a rule of thumb, the fresher the data must be, the further down the table the method sits.
ETL and ELT
ETL and ELT both extract, transform, and load data, but in a different order. ETL transforms data before loading it, which suits strict rules and older on-premises warehouses. ELT loads raw data first and transforms it inside the warehouse with tools like dbt. This order is the common pattern for cloud warehouses, because raw data stays available for later fixes.
Data integration tools such as Fivetran and Airbyte handle the extract and load steps for standard sources. Data Prism’s comparison of ETL tools covers how the main platforms differ and what each one costs.
Change Data Capture and Replication
Change data capture (CDC) copies only the rows that changed in a database, instead of reloading whole tables. CDC tools such as Debezium read the database’s change log and pass each change to a stream like Kafka. Replication uses the same idea to keep a full copy of a database in sync. Both suit large, busy databases where nightly full loads take too long.
API-Based Integration
API-based integration pulls data from each application through the interface its vendor publishes, such as the Salesforce or Shopify API. This method suits SaaS tools and syncs that need near-real-time data. Its weak spot is coverage, since some older ERPs and portals have no usable API. Custom API integration work fills the gaps where no ready-made connector exists.
Data Virtualization
Data virtualization lets teams query data where it already lives, without copying it into a warehouse. A virtualization layer such as Denodo sends each query to the source systems and returns one combined answer. This approach is quick to set up. However, heavy queries can slow the source systems, so it rarely replaces a warehouse for daily reporting. Instead, it usually sits beside the warehouse as one pattern in a wider integration architecture.
Data Integration Examples
Data integration examples are easiest to judge by the systems connected and the result. The three cases below come from sales and finance, marketing, and e-commerce. Grafana Labs leads, because its mix of CRM, ERP, and ad platforms matches what many growing companies run.
Sales and Finance: CRM Plus ERP
Sales and finance teams integrate the CRM with the ERP so deals, invoices, and payments line up. Grafana Labs, a B2B observability software company, connected NetSuite, Salesforce, Marketo, Google Ads, and more than 15 other sources into BigQuery. Its team then built a Customer 360 dashboard in two weeks.
Fivetran’s case study reports that the setup saved the equivalent of more than one full-time employee in manual work. Connecting billing, usage, and sales data also let Grafana tie sales pay to how much customers use the product. The company ran this setup for two years without dedicated data engineers.
Marketing: Ad Platforms Plus Analytics
Marketing teams integrate ad platforms, social channels, and analytics so campaign results sit in one report. Freestak, an influencer marketing platform, had campaign data split between Instagram and Facebook. Data Prism normalized both feeds into one consistent format, which helped Freestak onboard Under Armour, Nike, and New Balance with reliable reporting.
Ecommerce: Store, Inventory and Marketplace Data
Ecommerce teams integrate store, inventory, and fulfillment systems so an order’s status matches everywhere. Kaemark, a US maker of professional furniture and equipment, ran orders through WooCommerce and tasks through ClickUp, with records in Google Sheets and SQL Server. Data Prism connected all four systems, so updates sync around the clock.
The results showed up in staff time. Manual data entry fell by 50% to 80%, and Kaemark’s operating costs dropped by 50%.

Benefits of Data Integration
The benefits of data integration are easiest to see in hours saved and errors avoided. Each benefit below already appears earlier in this article with a real company behind it. The table pairs each one with its evidence.
|
Benefit |
What Changes |
Evidence |
|---|---|---|
|
Trusted Numbers |
Teams report from one set of definitions |
67% of organizations don’t fully trust their data (Precisely) |
|
Less Manual Work |
Pipelines replace copy-and-paste reporting |
Grafana Labs saved over one FTE of manual work |
|
Lower Costs |
Less rework and cheaper infrastructure |
Kaemark cut operating costs by 50% |
|
Faster Answers |
Data is ready before the question |
Scout processing fell from 84 hours to 2 |
|
AI Readiness |
Models train on clean, joined records |
Unity lost training data value after a bad feed |
The importance of data integration grows with every new tool a company adds, because each tool creates another place for the numbers to drift apart. Every disconnected tool adds to the company’s data silos, which integration joins back into one view.
Common Data Integration Challenges
The most common data integration challenges come from source systems and people more than from tools. Teams often inherit systems nobody documented, so mapping the data takes longer than building the pipeline. Vendors also change their data structures without warning, which breaks pipelines that worked the day before.
Older systems are harder still. Some have no API at all, so data has to come from file exports or direct database access.
Data quality is the quiet risk underneath all of this. Integration combines bad records as faithfully as good ones, so an error in one system spreads to every report. Data Prism’s post on why integration projects fail covers cases where the connectors work, but the numbers don’t.
Data Integration vs Related Terms
Data integration is often confused with three related terms that describe different jobs. The table sets data migration, application integration, and ETL side by side. Each comparison below then explains where the line falls.
|
Term |
Main Job |
How Long It Runs |
Typical Owner |
|---|---|---|---|
|
Data Integration |
Combine data for reporting and analysis |
Ongoing |
Data team |
|
Data Migration |
Move data from an old system to a new one |
One project |
IT or project team |
|
Application Integration |
Let apps trigger and update each other |
Ongoing |
IT or engineering |
|
ETL |
One method of moving and shaping data |
Each pipeline run |
Data engineers |
Only ETL sits inside data integration; the other two are separate disciplines that share some tools.
Data Integration vs Data Migration
Data integration vs data migration comes down to time. Migration is a one-time move, such as shifting records from an old ERP to NetSuite, and it ends when the old system is switched off. The guide to data migration covers the strategies and steps behind that kind of move. Integration keeps data flowing between live systems for as long as they run. A separate post on migration vs integration compares the two in more depth.
Data Integration vs Application Integration
Data integration vs application integration is a difference in purpose. Data integration gathers data so people can analyze it, usually in a warehouse. Application integration connects apps so they act on each other’s events, such as a new Shopify order creating an invoice in QuickBooks. Many companies need both.
Data Integration vs ETL
Data integration vs ETL is a question of scope, since ETL is one method of doing data integration. By the usual data integration definition, the goal is combining data into one view. ETL is a specific pipeline pattern that extracts, transforms, and loads data to reach that goal. CDC, APIs, and virtualization reach the same goal by other routes.
How to Get Started With Data Integration
Getting started with data integration begins with the one report that costs the most hours each week. Trace where its numbers come from and list every source system behind it. Then name an owner for each source and agree on how each metric is defined.
Not every business needs a full project yet. A team with two or three standard tools can often use the native connectors those tools already include. A project makes sense once several systems feed recurring reports and people reconcile the numbers by hand every week.
Effort grows with the number of sources and with every source that lacks an API. Messy data adds cleanup time before any pipeline is useful. Real-time needs also cost more than daily batch loads.
Integration is ongoing work, since sources change and pipelines need monitoring after launch. Teams without that capacity in-house can bring in data integration services for the build and the upkeep. Data Prism has shipped more than 100 data integration projects over six years.
Before choosing a tool or a partner, an evaluation guide helps compare options against the sources and reports that matter most.
Not sure where your data stands? Book a free consultation, and we will map your sources and show you what an integrated setup looks like.
Book a Free 30-Minute Meeting
Discover how our services can support your goals — no strings attached. Schedule your free 30-minute consultation today and let's explore the possibilities.
Book a Free Call

