
Data Analytics Consulting Services
Business data becomes more valuable when it is transformed into reliable reporting, analytics, and actionable insights. Organizations use data analytics consulting services to improve visibility, support confident business planning, and drive measurable business performance.
- 25%Revenue Growth Achieved
- 360°Business Visibility
- 50%Improved Data Accessibility
- 2XFaster Analysis
Key Takeaways
Actionable Business Insights: Transform raw data into information that supports confident business decisions.
Analytics at Scale: Support growing data volumes, reporting requirements, and business workloads.
Data-Driven Growth: Identify trends, opportunities, and performance improvements across the organization.
Data Analytics Services We Offer
Business & Operational Analytics
Analyze operational, financial, customer, and performance data to identify trends, bottlenecks, risks, and improvement opportunities.
BI Reporting
Build governed reporting environments with consistent metrics, automated refreshes, role-based access, and reliable business calculations.
Custom Dashboard Development
Build dashboards around KPIs, user roles, filters, and reporting workflows so teams can monitor performance through a focused interface.
AI-Powered Data Pipelines
Automate data pipelines that prepare, process, and deliver trusted data for analytics, reporting, and AI initiatives.
Big Data Analytics
Process high-volume and complex datasets to identify patterns, analyze performance, and support planning across large-scale workloads.
Modernization of Existing Analytics
Replace outdated reporting tools and fragmented analytics workflows with scalable platforms that improve accessibility, performance, and maintenance.
Business Challenges Data Analytics Can Solve
Success Stories
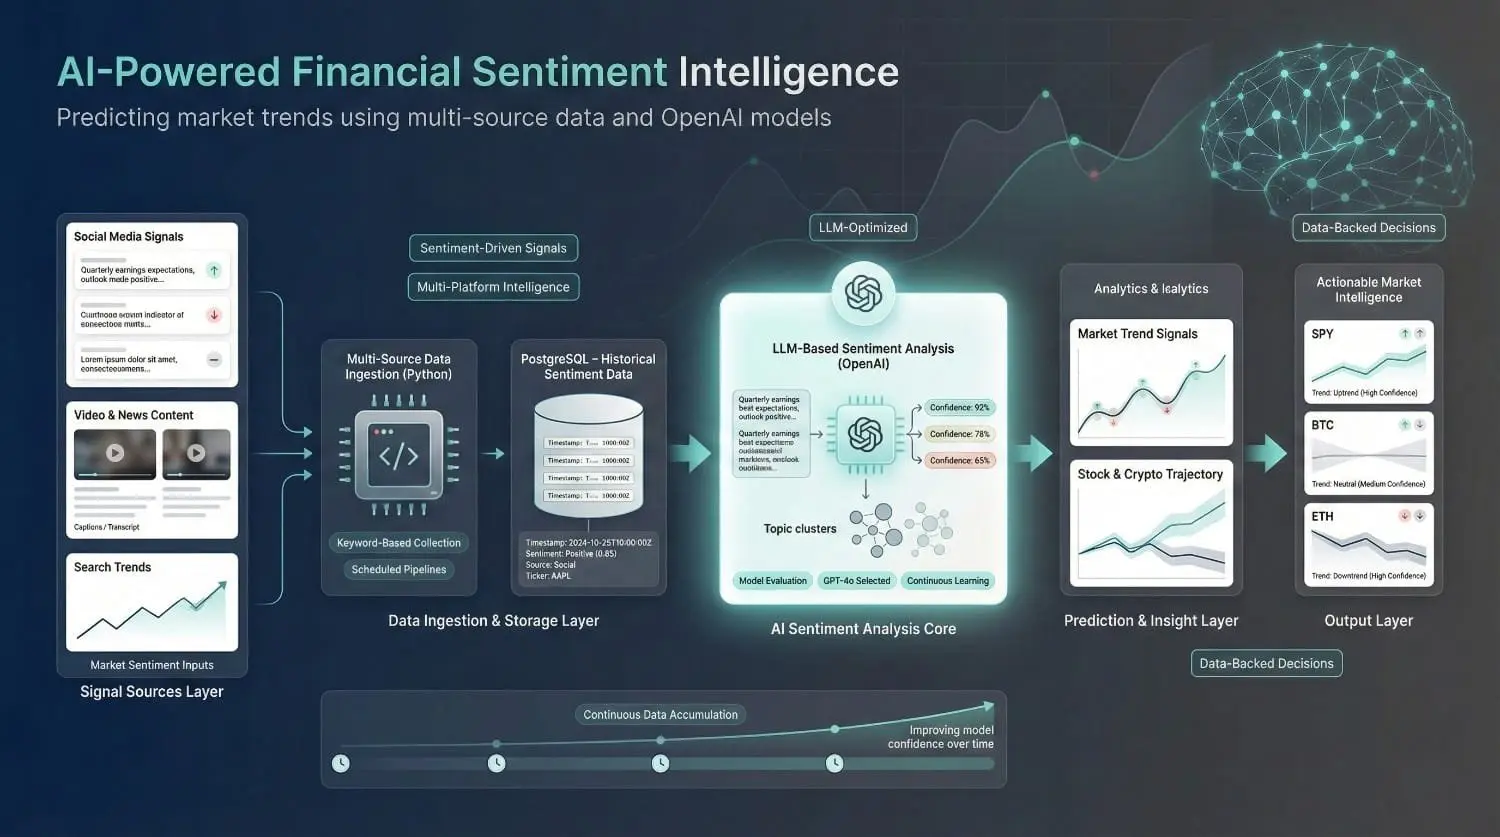
Financial Predictor using Sentiment Analysis via OpenAI API (for Maxx Source)
Maxx Source needed a sentiment analysis system for stocks and cryptocurrencies. DataPrism built a pipeline that gathered multi-platform data and used GPT-powered analysis to predict market trends.
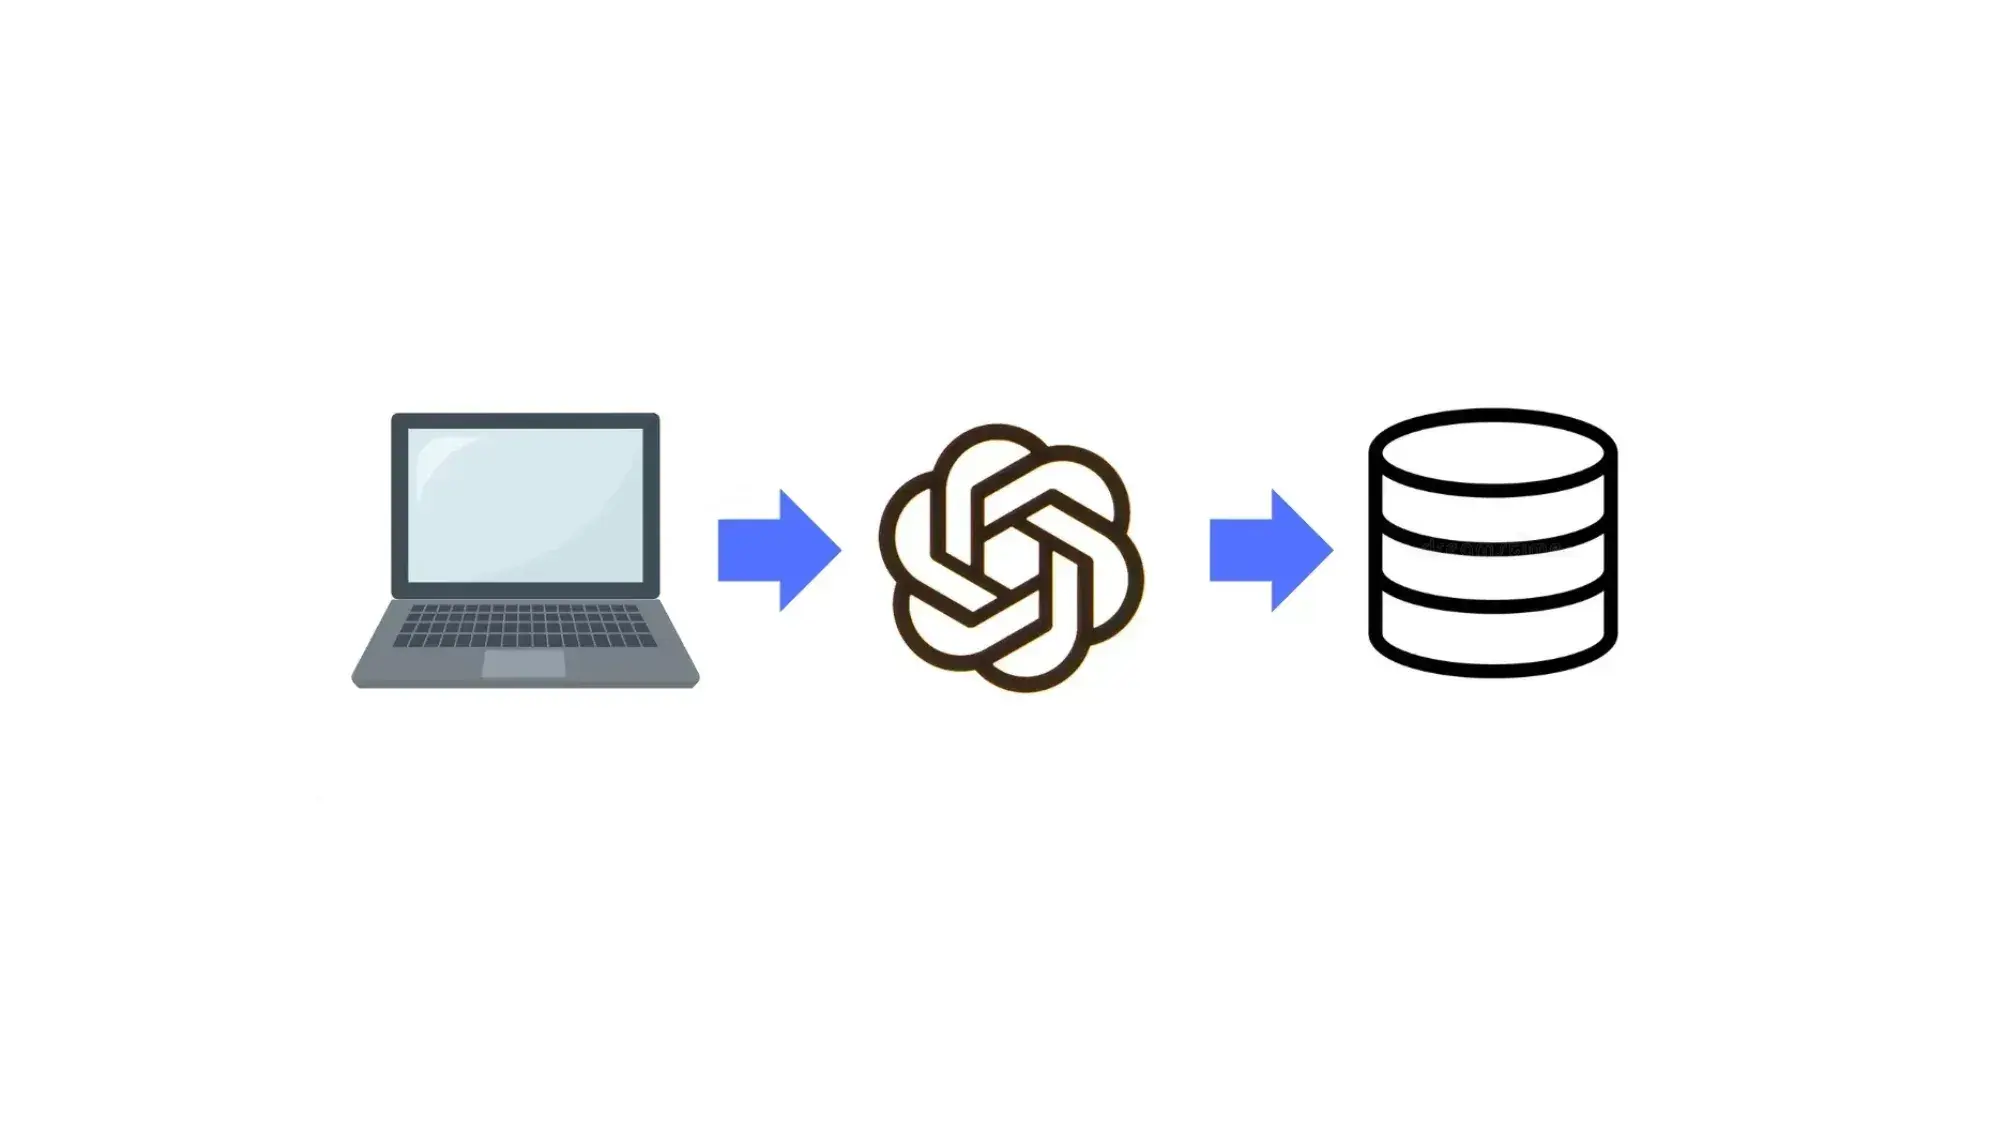
Natural Language Database Lookup System (dbGPT)
We created an intelligent lookup system (using the OpenAI) that can understand natural language prompts and convert them into SQL queries to retrieve the required information from a database.
Our Certifications




Our Data Analytics Process
Each project follows a structured process that connects business requirements with reliable data and practical analytics. We start with business requirements and go all the way to ongoing optimization, passing through data preparation, solution development, validation, and deployment.
Assess Business Requirements
Our process begins by understanding business goals, reviewing reporting needs, and studying existing data sources. These findings define the analytics scope, priority metrics, and success criteria.
Prepare and Organize Data
Once the requirements finalized, relevant data is collected, cleaned, transformed, and modeled. This creates a reliable foundation for consistent reporting and analysis.
Build Analytics Solutions
Once the data is ready, dashboards, reports, analytical models, and supporting workflows are developed around the approved requirements. The solution architecture, calculations, and user experience are finalized during this stage.
Validate and Deploy
Before release, reporting logic, calculations, metrics, filters, and solution performance are tested for accuracy and consistency. The approved solution is then deployed and integrated into existing reporting and operational workflows.
Monitor and Optimize
After deployment, we continue to observe the performance of the implemented solution. Based on the adoption and changing needs, targeted improvements are planned to keep your analytics accurate and useful.

Turn Data Into Business Insights
Discuss Your Analytics StrategyIndustries We Serve as Data Analytics Company
Healthcare
Analyze clinical, operational, and reporting data to improve visibility, healthcare outcomes, regulatory compliance, and resource planning.
Finance & Banking
Support risk analysis, compliance reporting, fraud detection, and financial performance monitoring across financial operations.
Retail & Ecommerce
Analyze customer, inventory, sales, and operational data to improve forecasting, revenue growth, and business performance.
SaaS & Technology
Track product usage, customer behavior, and business performance across digital platforms to support growth and retention.
Operations & Supply Chain
Analyze procurement, fulfillment, logistics, and inventory data to improve operational visibility and performance monitoring.
Real Estate & Property Management
Analyze property performance, occupancy trends, leasing activity, and financial data to support portfolio growth and investment decisions.
Tools and Technologies
- AWS
- Azure
- GCP
- PostgreSQL
- MongoDB
- Snowflake
- BigQuery
- DBT
- Python
- Redshift
- Looker Studio
- Power BI
- Tableau
- AWS Glue
- Azure Functions
- Google Cloud Storage
- Google Cloud Run
- Google Cloud Tasks
- MySQL
- Apache Airflow
- Apache Kafka
- Databricks
Why Choose Data Prism for Data Analytics Consulting
Reliable analytics depends on more than dashboards and reports. Data Prism combines business-aligned planning, data engineering, BI, scalable architecture, and ongoing optimization to deliver accurate reporting, clearer visibility, and measurable outcomes.
Business-Centered Analytics
Dashboards lose value when metrics, layouts, and workflows do not match how teams make decisions. We design reporting environments around business goals, KPIs, user roles, and practical reporting needs.
Well-Defined Plans
Analytics projects can drift when objectives, priorities, and success measures are unclear. Our consultants define the use case, reporting strategy, data requirements, and delivery roadmap before implementation begins.
Scalable Analytics Solutions
Reporting platforms often slow down as data volumes, users, and refresh demands increase. Our engineers design models, pipelines, and architectures that scale without unnecessary complexity.
Data Engineering Capabilities
Reliable analytics depends on accurate and well-managed data. Our engineers build pipelines, integrations, models, and quality controls that keep reporting consistent and up-to-date
Outcome-Focused Delivery
Analytics should solve business problems rather than generate more reports. Our delivery focuses on measurable outcomes, improved operational visibility, and practical insights teams can act on.
Ongoing Analytics Support
Reporting needs change as systems, KPIs, and user expectations evolve. We provide performance reviews, enhancements, and targeted optimization to keep the solution reliable and useful.
Our Clients












Frequently Asked Questions
Tell us about your project
Share your details and we'll reply within one business day.