

Introduction
On November 9, 2026, Somnigroup, the owner of Tempur Sealy and Mattress Firm, reported a 34.7% drop in third-quarter net sales at Dreams, its UK bed retailer. The company tied the fall to a new ERP system, which caused operational disruption throughout the quarter. The rest of Tempur Sealy International grew sales by high single digits over the same period.
So, why can changing the systems that store company data hurt a business this much? Data silos are part of the answer. They are pockets of data that one team or system keeps apart from the rest of the company, and most firms have them long before they try to connect them.
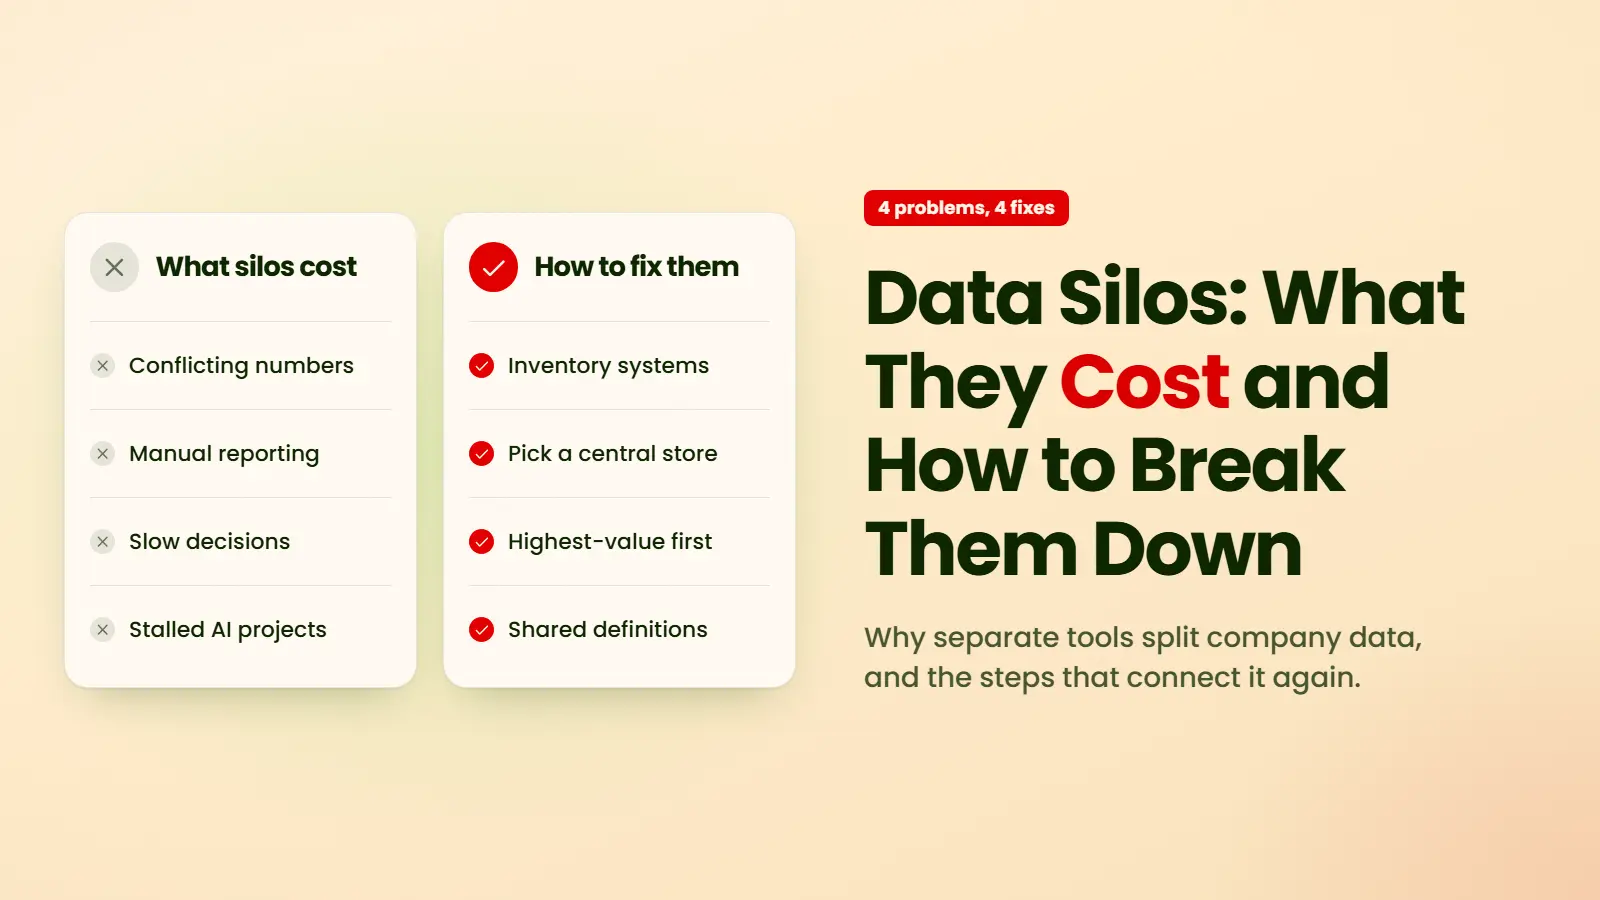
The cost of data silos shows up first as lost staff hours and duplicate tools. Missed revenue follows. The fix starts with connecting the systems that matter most, one at a time.
This article explains what data silos are and why they form, what they cost, and how to break them down.
What Are Data Silos?
Data silos are collections of data stored by one team or system that the rest of a company cannot easily reach or combine. So, what is a data silo in practice? A typical data silos example is a CRM, an accounting tool, and an e-commerce platform that never share records. Each works well alone, until a question needs all three.
The data silos meaning is easiest to see in a meeting. Sales reports one revenue figure from the CRM, while finance reports another from the accounting system. Both teams are right about their own system, but neither number covers the whole business. Data integration is the process that joins the systems into one consistent view.
Why Data Silos Form
Data silos form because companies add systems faster than they connect them. Each new tool solves one team’s problem. Nobody plans how its data will reach the rest of the business. Four causes account for most of them.
Each Team Buys Its Own Tools
Separate software purchases are the most common cause of a data silo. Marketing picks an email platform, sales picks a CRM, and support picks a help desk. Each tool stores customers in its own format.
The number of tools has grown fast. Salesforce’s 2026 Connectivity Benchmark found that the average enterprise uses 957 applications, up from 897 a year earlier. Only 27% of them are integrated.
Growth by Acquisition
Acquisitions create data silos overnight, because the bought company arrives with its own systems. It keeps its own ERP, customer list, and product codes. Two versions of the business then run side by side until someone merges them.
Merging them with a one-time data migration can move old records into one system, but it doesn’t keep two live systems in step. Keeping both systems in sync is integration work, which acquisitions usually skip.
Legacy Systems With No APIs
Older systems trap data because they were never built to share it. Many on-premises ERPs, custom databases, and industry tools have no modern API. The only way to get data out is an export file or a manual report.
Teams work around this with spreadsheets that someone updates by hand each week. Building API integration or a scheduled extract replaces the spreadsheet with a feed that runs on its own.
No One Owns the Data
Silos persist when no single person owns company data. Each department controls its own system and has little reason to share. Shared definitions never get agreed, because nobody has the authority to settle them.
Practitioners agree. In a popular Reddit thread on the topic, the top answer called silos a people and process problem, fixed only when one leader gets authority over data.
Why Data Silos Are a Problem
Data silos are a problem because they make every cross-team question slow and every answer doubtful. Ask why are data silos problematic, and most teams describe four everyday issues. Each one compounds as the company grows.
Conflicting Numbers
Siloed data produces conflicting numbers because each system counts the same thing its own way. The CRM counts a deal when it closes, while accounting counts it when the invoice is paid. Both totals are accurate, and they still disagree.
Salesforce’s State of Data and Analytics report, from surveys run in mid-2025, found that data leaders estimate 26% of their company’s data is untrustworthy. Data leaders put another 19% down as siloed, inaccessible, or otherwise unusable.
Manual Reporting Work
Manual reporting is the daily tax that data silos charge. An analyst exports data from three systems and pastes it into a spreadsheet. The analyst then fixes the mismatches by hand. The monthly report takes a week, and it is out of date when it lands.
The work grows with every new tool and report. Automated data pipelines remove the export step, so the analyst checks numbers instead of building them.
Slow Decisions
Slow decisions follow from slow reports. When a pricing question needs data from sales, finance, and operations, someone has to request each piece and wait. By the time the answer arrives, the moment to act has often passed.
The delay also changes how leaders decide. Meetings turn into debates about whose number is right. Decisions then fall back on instinct.
AI Projects That Stall
AI projects stall on siloed data, because a model can only use the data it can reach. Salesforce’s 2026 benchmark found that 96% of organizations face barriers to using data for AI. Of those, 40% named outdated architecture caused by data silos or disconnected systems as a top blocker.
A chatbot that can’t see order history gives wrong answers. An AI readiness check usually finds data access, not the model, as the first gap to close.
The Cost of Data Silos
The cost of data silos falls into three buckets, and most companies never total them. Each cost hides inside a different budget. The table shows where each one sits.
|
Cost |
Where It Hides |
First Sign |
|---|---|---|
|
Staff Time |
Salaries of analysts and managers |
Reports take days to build |
|
Duplicate Spend |
Separate software and storage budgets |
Two tools doing the same job |
|
Missed Revenue |
Sales and marketing results |
Upsells and renewals slip past |
The figures below come from published surveys, so they show the pattern rather than any one company’s bill.
Hours Lost to Manual Reporting
Time spent hunting for data is the highest and least visible cost. It never appears as a budget line. Quickbase’s 2025 Gray Work survey of nearly 2,200 professionals found that 59% spend over 11 hours a week just searching for information.
The lost hours belong to people hired for other work. An operations manager rebuilding the same weekly report is not improving operations.
Duplicate Tool and Storage Spend
Siloed teams often pay for the same capability twice. Two departments buy separate reporting tools, or store the same customer records in three systems. Each copy needs its own license, storage, and upkeep.
Duplicate data also costs more to keep clean. When one copy of a customer record is missed, the sales process runs on stale records. A sales rep then calls a customer about an order that support has already cancelled.
Missed Revenue From Incomplete Customer Views
Missed revenue from incomplete customer views is the hardest cost to see, because it never appears on a report. A company that sees only part of each customer misses upsells and renewal risks. AI projects make the loss easier to measure.
A Fivetran survey of 401 data leaders and professionals, published May 13, 2025, found that 42% of enterprises say more than half of their AI projects were delayed, underperformed, or failed because of data readiness.
Among organizations with less than half their data centralized, 68% reported lost revenue tied to failed or delayed AI projects.
How to Spot Data Silos in Your Company
Data silos are easy to spot once you know the symptoms of a data silos problem. Most companies with silos show several of the signs below at once. Count how many apply to your business.
- Two teams report different figures for the same metric.
- A routine monthly report takes more than a day to build.
- Staff export data to spreadsheets to combine it.
- Nobody can say which system holds the correct customer record.
- A key system has no API or scheduled export.
- New tools are bought without anyone checking how they connect.
- An AI or analytics project stalled while waiting for data.
Three or more signs usually point to a silo problem worth fixing.
How to Break Down Data Silos
Breaking down data silos takes a mix of technical and organizational fixes, and integration usually pays back first. Moving data into one place solves little if teams still define metrics differently. The steps below run in order, and each makes the next easier.
Most companies need outside help for at least one step. Data integration consulting usually covers the inventory, the target design, and the first pipelines. Internal teams then own the definitions and governance work.

Inventory Your Systems and Owners
The first step is a list of every system that stores business data, with one named owner for each. Include spreadsheets and shared drives, because they often store the workarounds teams rely on. Note how data gets in and out of each one.
The inventory shows where the silos are and who must agree to change them. It also exposes duplicate tools to retire. The same list later becomes the source layer of the integration architecture.
Pick a Central Warehouse or Lake
A central store gives every team one place to read data from. A data warehouse stores structured, cleaned data for reporting. A data lake stores raw data of any type at lower cost.
Most growing companies start with a warehouse, because their first goal is reporting they can trust. Teams with large volumes of logs or event data often add a data lake later.
Integrate the Highest-Value Sources First
Start with the sources that feed your most visible report, not with every system at once. Finance data is often the best first source. It is usually the cleanest, and leaders already watch it. A visible early win builds the support the rest of the project needs.
One practitioner on Reddit described this approach for a monthly executive report. The team centralized accounting data first, then required every department to feed the report from the central database.
However, projects that connect everything at once often stall. Many integration projects fail even when every connector works. Nobody agreed what the combined data should mean.
Set Shared Definitions and Governance
Shared definitions decide what each metric means, so every team calculates it the same way. Agree what counts as a customer, a sale, and revenue, then write the rules down. Without them, a central warehouse just stores the same disagreements in one place.
Governance keeps the rules in force with owners, quality checks, and access controls. A data governance program also needs an executive sponsor, because some teams will lose control of data they consider theirs.
When Data Silos Are Fine to Leave Alone
Not every company needs to eliminate data silos, because some hold data nobody needs combined. If marketing only uses marketing data and accepts finance figures a month late, a new system to join them adds cost. The new system also needs its own owner and upkeep. When a team only needs an occasional combined view, lighter integration techniques such as data virtualization can query each source in place.
Other silos exist on purpose. Health records, payroll, and legal files are often kept apart for privacy or compliance. The test is simple. Integrate a silo when a real decision needs its data. If none does, leave it alone.

Example: From Four Disconnected Systems to One Source of Truth
Kaemark, a US manufacturer of professional furniture and equipment, ran orders and production across four disconnected systems. Orders lived in WooCommerce, tasks in ClickUp, operational data in Google Sheets, and reporting in SQL Server. Staff kept them in step by hand, which caused repeat work and inconsistent records.
The fix connected all four systems. Webhooks pushed order status changes between WooCommerce and ClickUp. A Node.js sync moved operational data from Google Sheets into SQL Server. This gave manufacturing, logistics, and sales one reporting foundation.

The Kaemark project cut manual data entry by 50% to 80% and reduced operational costs by 50%. Sales, production, and fulfillment teams now work from the same order data.
Where to Start With Data Silos
Everything above starts with a map of where data lives, because data silos rarely fix themselves. Each new tool adds another silo. The useful next step is a short review of which connection would pay back first. The review then shapes the plan for the data engineering work behind it.
A short integration audit maps every source and produces a build plan before any work starts. It suits a company that knows it has silos but not where to begin.
Book a Free 30-Minute Meeting
Discover how our services can support your goals — no strings attached. Schedule your free 30-minute consultation today and let's explore the possibilities.
Book a Free Call

