

Introduction
What Is Data Integration Architecture?
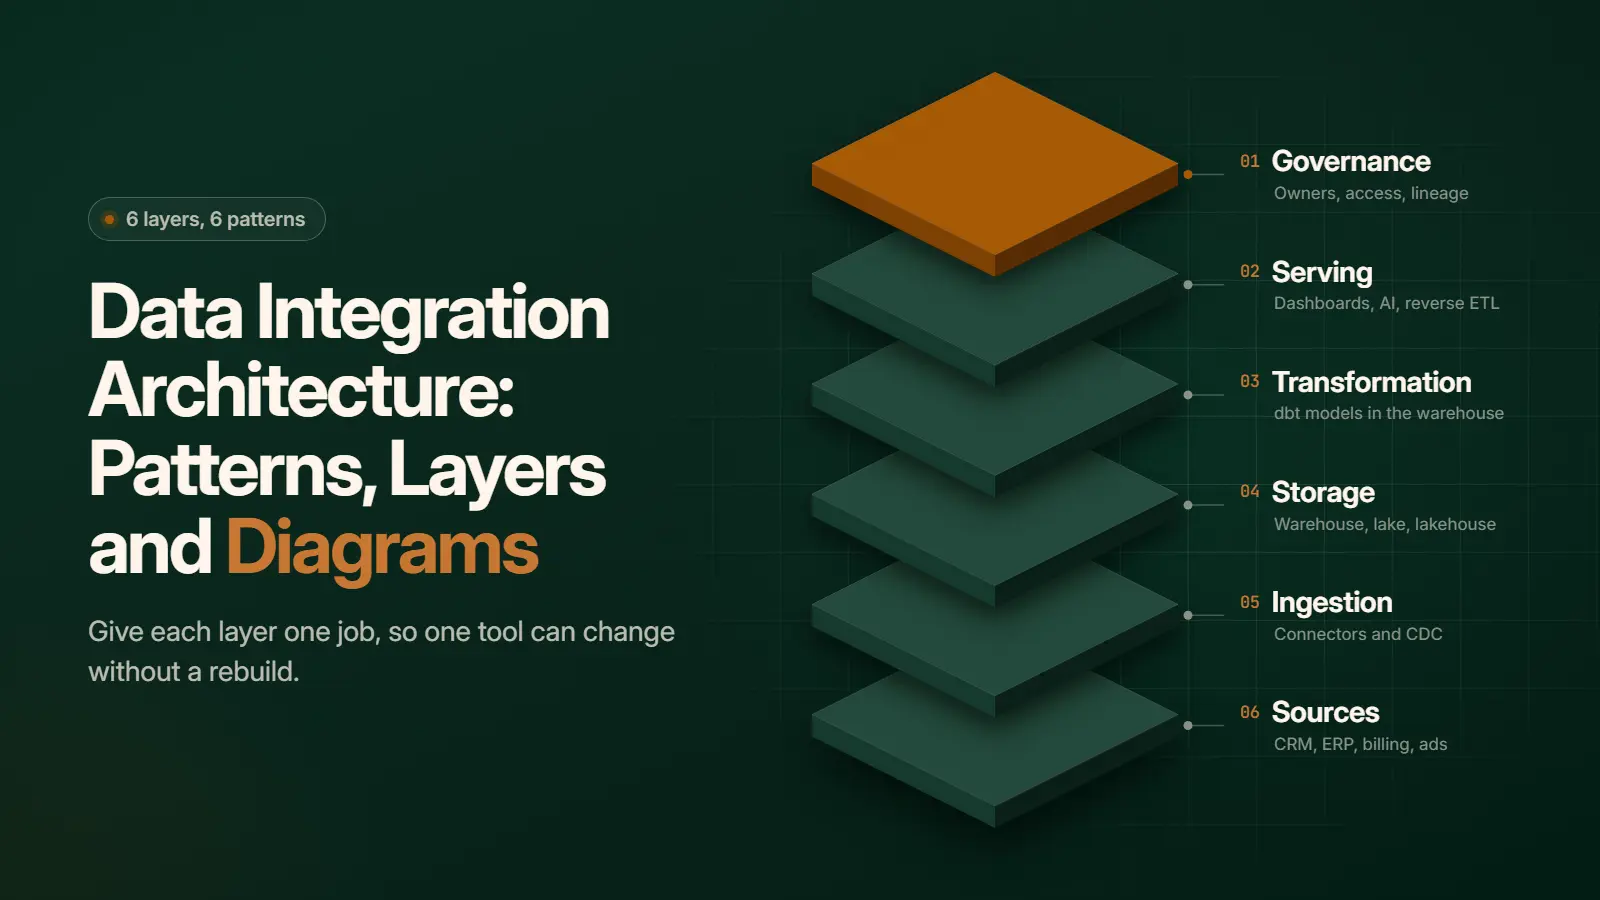
The Layers of a Data Integration Architecture
Data Integration Architecture Patterns
Data integration architecture patterns describe how the layers connect, and six of them cover almost every stack. Each pattern trades build effort against flexibility and cost. The patterns sit one level above the integration techniques, such as ETL and CDC, that actually move the data.
The table compares the six patterns by fit, main cost driver and the point where each stops fitting.
|
Pattern |
Best Fit |
Main Cost Driver |
Relative Cost |
Stops Fitting When |
|---|---|---|---|---|
|
Point to Point |
A few systems sharing data directly |
Engineer time per new connection |
Low, then rising |
Nobody can track every connection |
|
Hub and Spoke |
Many sources feeding shared reports |
The hub platform and its team |
Medium |
One team becomes the bottleneck |
|
Warehouse-Centric ELT |
Analytics on cloud data |
Warehouse compute |
Low to medium |
Data must act within seconds |
|
Event-Driven and Streaming |
Decisions made within seconds |
Always-on clusters and scarce skills |
High |
Daily reports are enough |
|
Data Virtualization |
Querying data where it lives |
Query load on source systems |
Low to medium |
Sources are slow or busy |
|
Data Mesh and Data Fabric |
Business units with their own data teams |
Platform team and governance overhead |
High |
One central team still copes |
Cost rises with the freshness and independence a pattern promises, so the cheapest pattern that answers the business questions usually wins.
Point to Point
Point to point connects each system directly to every system that needs its data. It is the fastest way to start and works while a company runs a few sources. Every new system adds connections to the others, so maintenance grows faster than the stack. Most teams only notice its cost after they outgrow it.
The usual signal to move on is two reports that disagree on the same number, because point to point has no single place to reconcile them.
Hub and Spoke: The Data Integration Hub
Hub and spoke routes every source through one central data integration hub, which then feeds every destination. Each source connects once, to the hub, so a new system means one new connection. The risk is a bottleneck when one small team owns the whole hub.

Today the hub is usually a cloud warehouse, which is the modern form of the pattern.
Warehouse-Centric ELT
Warehouse-centric ELT loads raw data into a cloud warehouse first and transforms it there. ELT stands for extract, load, transform. The order matters because raw history stays available when business rules change. It is the default stack for most growing US businesses.
The main cost is warehouse compute, which grows with every model rebuild and query. Classic ETL, which transforms data before loading it, still suits cases where raw data must never land in the warehouse.
Event-Driven and Streaming
Event-driven integration moves each change as an event the moment it happens, usually through Apache Kafka or a managed service built on it. The pattern suits fraud checks, inventory and pricing, where a delay of minutes costs money. It is overkill for a report someone reads once a day.
Streaming also needs skills many teams lack, so most teams stream only the few sources where speed changes a decision.
Data Virtualization and Federation
Data virtualization queries data where it lives, without copying it into central storage first. A virtual layer accepts one query and splits it across the source systems, a method also called federation. It suits quick access to data that changes often or can’t be copied for legal reasons.
Virtualization is a good bridge while a warehouse is being built, though heavy dashboards load production systems.
Data Mesh and Data Fabric
Data mesh and data fabric are operating models layered on top of the other patterns. In a data mesh, each business unit owns and publishes its own data products under shared standards. A data fabric uses metadata and automation to connect data across many platforms.
A company with one central data team gains little from either model, because the governance overhead arrives long before the benefits.
Data Integration Architecture Diagrams by Company Size
The right data integration architecture diagram depends mostly on how many sources a company runs and how many teams use the data. The three reference diagrams here work as data integration architecture examples for a small team, a mid-market company and an enterprise. Each diagram adds layers only when the company size calls for them.

The table lists common tool choices for each layer at each company size, with no vendor favored.
|
Layer |
Small Team |
Mid-Market |
Enterprise |
|---|---|---|---|
|
Ingestion |
Fivetran or Airbyte |
Fivetran or Airbyte, plus Debezium |
Managed connectors, Debezium and Kafka |
|
Storage |
BigQuery or Snowflake |
Snowflake, BigQuery or Databricks |
Lakehouse on Databricks or Snowflake |
|
Transformation |
dbt |
dbt with tests and CI |
dbt projects per business unit |
|
Orchestration |
Schedulers built into each tool |
Airflow or Dagster |
Airflow or Dagster per business unit |
|
Serving |
One BI tool |
BI tools plus reverse ETL |
BI tools, reverse ETL and AI agents |
|
Governance |
A shared ownership sheet |
A catalog and access roles |
An enterprise catalog and data contracts |
Each step up adds control and team cost, so moving up too early wastes money just as moving up too late does.
Small Team, Under 10 Sources
A small team with fewer than 10 sources needs a simple warehouse-centric ELT diagram. Managed connectors handle data warehouse integration for CRM, billing and ad data. A dbt project models the tables, and one BI tool reads them. One engineer can run this stack.
The diagram is a single left-to-right line from sources to dashboards, and every job runs on a schedule.
Mid-Market, 10 to 50 Sources
A mid-market company with 10 to 50 sources needs the same warehouse hub plus CDC and an orchestrator. Database sources move through CDC, so the warehouse stays current without heavy extracts. Airflow or Dagster runs the jobs in order and alerts on failures.
The diagram becomes hub and spoke, with the warehouse at the center and two-way arrows to operational tools. This step is where most data architecture design work happens, because every source needs a settled owner.
Enterprise, Multiple Business Units
An enterprise with several business units needs a federated diagram, with each unit running its own pipelines on a shared platform. A central team runs data lake integration into a shared lakehouse and owns the catalog. Domain teams own their data products and publish them for others.
Enterprise diagrams also have to show legacy systems and the path off them. Planning the migration path is a large part of architecture consulting at this size.
How to Design Your Data Integration Architecture
Architecture Mistakes That Raise Cost Later
The architecture mistakes that raise cost later are usually choices that worked at a smaller size. A database that handled the first million rows struggles at a hundred million. Each shortcut becomes rework.
The Scout data platform shows the pattern. Its analytics ran on PostgreSQL, an operational database, while the data grew past 200 million consumer records. Data Prism moved the platform to Snowflake for analytics and OpenSearch for search, with Amazon S3 staging. Processing time fell from 84 hours to 2 hours, and monthly infrastructure cost fell from about $4,000 to $40.

Custom one-off integrations carry a similar hidden cost. Fivetran’s survey of 500 IT, data and AI leaders found that 53% of companies relying on custom integrations lose at least a quarter of their AI spending to avoidable work, while 40% of those on standardized platforms do.
Is a Formal Architecture Worth It?
Book a Free 30-Minute Meeting
Discover how our services can support your goals — no strings attached. Schedule your free 30-minute consultation today and let's explore the possibilities.
Book a Free Call