

Introduction
The US Department of Agriculture changed how it checks crop data this month. Its National Agricultural Statistics Service (NASS) traced an error in its corn data for Kansas and Nebraska to an acreage file used to process the September numbers. The file combined irrigated and nonirrigated acres with the wrong weights.
The mistake raised national corn yield and production estimates in the October report. So, NASS added an anomaly-detection check before releasing its November 10 report.
The error sat in a processing file, not in the farm surveys. It happened in the step that combined two datasets. A clear data integration process catches mistakes like this before the numbers reach a report. This article explains the seven steps from source to dashboard, the deliverable each step should produce, and what a project takes in time, people, and budget.
What Is the Data Integration Process?
The data integration process is the sequence of steps a team follows to move data from several source systems into one consistent model. The work runs from scoping and source profiling through to launch and ongoing monitoring. The output is a dataset that every report can trust without manual cleanup.
Data integration describes the goal, while the process describes the work. Most businesses need the process because their systems were never designed to share data. A CRM stores dates in one format, and an accounting tool stores them in another. An ad platform adds its own way of recording amounts.
The gap is wide even at large companies. Salesforce’s 2026 Connectivity Benchmark Report found that the average enterprise now runs 957 apps, with only 27% of them integrated together. The steps below show how to integrate data from multiple sources in a repeatable way.

Before You Start a Data Integration Project
Data integration projects move faster when four things are settled before the first meeting with engineers. A sponsor owns the business outcome and settles disputes about definitions. Someone with admin rights can grant read access to every source system. A budget range exists, even a rough one.
Security and compliance rules come fourth. Some data carries legal limits on where it can be copied and who can see it. Payroll and health records are common examples. The team should list the limits early, because they shape the choice of tools and hosting later.
Teams asking how to integrate data from different sources usually discover more sources than anyone listed. Old spreadsheets and exports create data silos that never appear on the official system map. Asking each department where its numbers come from is the fastest way to find them.
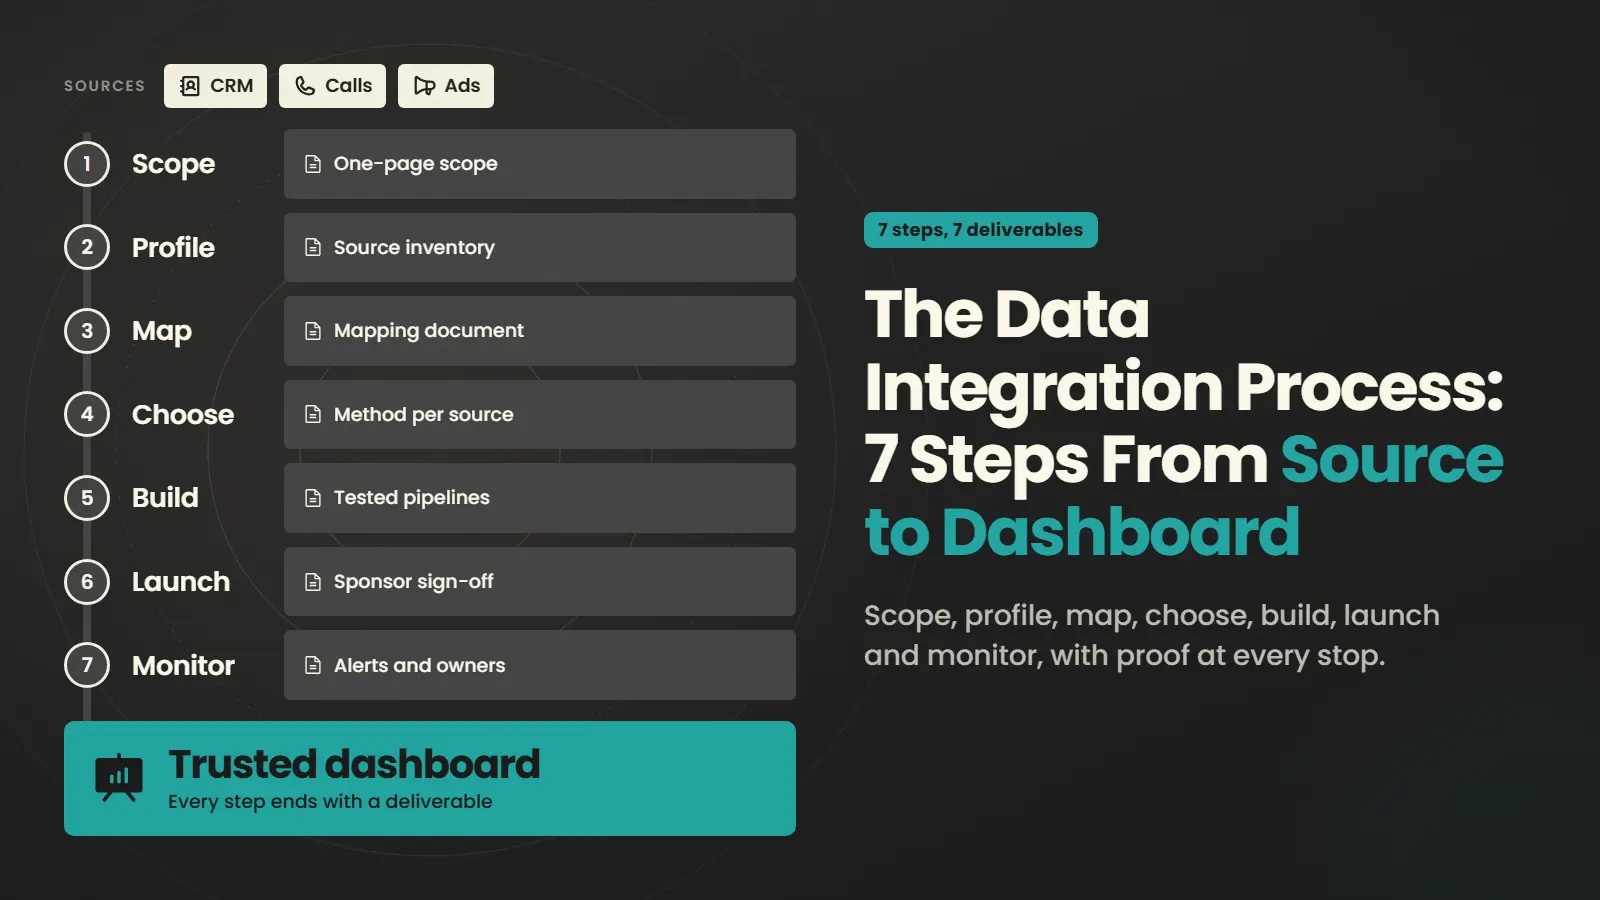
The seven steps below follow the same order as Data Prism’s five-step process, split more finely so a non-specialist can track progress. Each step ends with a deliverable. If the deliverable doesn’t exist, the step isn’t done.
One Data Prism case study runs through the steps as an example. Lost & Found Marketing, a marketing agency focused on roofing contractors, needed one reporting view across more than 15 CRM, marketing, call tracking, and operational systems. Data Prism built the platform on Google Cloud.
Step 1. Define the Business Questions and Scope
Scope starts with the questions the finished dashboard must answer, not with the list of systems. A question like “Which campaigns produce booked jobs, and at what cost per job?” tells the team which data matters far better than “connect everything” does. A narrow first question keeps the project small enough to finish and prove.
Each question should name its metric and its owner. It should also say how often the data needs a refresh. Weekly reporting allows a simple nightly batch. A sales team that acts on new leads within minutes needs something faster, and the cost rises with the speed.
AI projects follow the same rule. A model that reads integrated data needs the same agreed definitions as a dashboard does.
Lost & Found Marketing’s goal was specific. The agency needed reporting that connects each client’s marketing investment to business outcomes.
Step 1 ends with a one-page scope. It lists the business questions with their metrics and says what stays out of the first release.
Step 2. Inventory and Profile Your Data Sources
An inventory lists every system that holds data for the agreed questions. Profiling then looks inside each source. It measures how complete each field is and whether formats stay consistent. This step turns assumptions into facts before anyone writes code.
Profiling usually finds problems the business didn’t know it had. Phone numbers arrive in several formats. A “status” field holds values nobody remembers adding. One system deletes records instead of flagging them, so history disappears. A free quality assessment gives a first read on how much cleanup to expect.
In the Lost & Found Marketing project, the sources were several CRM platforms, call tracking tools, and marketing applications. Each one stored a different part of the customer journey.
Step 2 ends with a source inventory that names each system’s owner. A profiling summary sits beside it and flags the fields that need cleanup.
Step 3. Build a Source-to-Target Data Mapping
A source-to-target data mapping is a document that shows where each field in the target model comes from and what happens to it along the way. So, what is data mapping in practice? Each row lists a source system, source field, target field, and transformation rule.
The target model comes first. Analysts and the sponsor agree on the tables the dashboard will read, such as leads, jobs, and ad spend. The mapping then fills the tables from the sources. Where the model sits in the wider integration architecture decides whether transformations happen before or after loading.
The table below is a hypothetical mapping for a marketing dashboard. It shows the level of detail a useful mapping needs.
|
Source System |
Source Field |
Target Field |
Rule |
|---|---|---|---|
|
CRM |
createdate |
leads.created_at |
Convert to UTC |
|
CRM |
lifecyclestage |
leads.status |
Map values to agreed status list |
|
Call Tracking |
caller_number |
leads.phone |
Normalize to one phone format |
|
Google Ads |
cost_micros |
ad_spend.amount_usd |
Divide by 1,000,000 |
|
Google Ads |
campaign.id |
ad_spend.campaign_id |
Keep as text |
Every rule in the mapping is a business decision written down. The cost_micros row, for example, prevents ad spend from appearing a million times too large.

Step 3 is done when the sponsor signs off on a mapping that covers every field the first release needs.
Step 4. Choose the Integration Method and Tools
The integration method follows from the refresh frequency and the source type agreed in Steps 1 and 2. Many projects use more than one method. A nightly batch might load accounting data, while a change feed keeps orders current. The table below matches common methods to when they fit.
|
Method |
When It Fits |
Example Tools |
|---|---|---|
|
Batch ETL |
Strict rules applied before loading |
AWS Glue, Azure Data Factory |
|
ELT |
Cloud warehouse does the transforming |
Fivetran or Airbyte, plus dbt |
|
Change Data Capture |
Database changes needed within minutes |
Debezium |
|
Streaming |
Events processed as they happen |
Apache Kafka |
|
API Pulls |
SaaS tools without a ready connector |
Custom code on a schedule |
|
Virtualization |
Querying data in place without copying |
Trino, Denodo |
Fivetran and Airbyte are faster for common SaaS sources because their connectors already exist. Custom code makes sense for unusual APIs and complex logic. It also wins at very high volumes, where per-row pricing grows expensive. The full set of integration techniques covers each method in more depth.
Tool choice should follow the method, not the other way around. A comparison of ETL tools helps once the team knows whether it needs batch loading, ELT, or replication.
Sources without a ready connector need API integration work. This is common with niche CRMs and industry tools.
Lost & Found Marketing used custom connectors, built with Python-based ingestion, to pull CRM and marketing data from client systems. BigQuery served as the warehouse for both raw and modeled data.
Step 4 ends with a written decision for each source, naming the method and the reason behind it.
Step 5. Build and Test the Pipelines
Pipeline building turns the mapping into running code. Engineers write the extraction and transformation code. Scheduling then ties the pieces together. Testing happens during the build, not after it, because a defect is easier to trace in one pipeline than in a finished dashboard.
The Lost & Found Marketing build shows the typical layers. Cloud Run Functions normalized incoming records, and Firestore stored each data source’s configuration, schema, and destination. Dataform turned raw records into business-ready models, while Cloud Scheduler and GCP Workflows coordinated every run.
Pipeline development is the most engineering-heavy part of the project, so teams without in-house engineers often bring in outside help here.
Row Counts and Reconciliation
Reconciliation proves that the data in the target matches the data in the source. The simplest check compares row counts for the same period. If the CRM shows 1,240 leads created in October (a hypothetical figure), the warehouse should show 1,240 too.
Row counts only prove the right number of records arrived. Totals prove the values are right. Teams should compare sums of key amounts, such as revenue and ad spend, between source and target for the same dates. A mismatch usually points to a filter, a time zone, or a currency rule in the mapping.

Handling Bad and Duplicate Records
Bad records need a rule, not a manual fix. Each pipeline needs a rule for records missing a required field. Some teams reject such records outright, while others load them with a flag for review. Rejected records go to a separate table so someone can see what failed and why.
Duplicates need a matching rule agreed with the business. Two leads with the same email might be one person or a shared office inbox. The rule should be written into the mapping document, so every engineer applies it the same way.
Step 5 is done when the reconciliation checks pass for at least one full reporting period.
Step 6. Load, Validate, and Launch
The launch step loads the full history and switches reporting over. Business users validate the numbers first. Engineers can prove the pipelines run. Only the people who use the numbers can confirm the numbers make sense.
A parallel run is the safest launch. For two or more reporting cycles, the old report and the new dashboard run side by side. Any difference gets traced to its cause before the old report retires. The same discipline applies to migration testing, where validated history matters as much as new data.
Automated anomaly checks belong here too. The NASS fix works on the same idea. The check flags values that fall outside the expected range, so a person reviews them before the numbers go public.
Step 6 ends with the sponsor’s sign-off that the new dashboard matches the agreed definitions.
Step 7. Monitor, Document, and Hand Over
Monitoring keeps integrated data accurate after launch, because source systems change without warning. A vendor renames a field, or an API version expires. Alerts should fire when a run fails, or data arrives late. A reconciliation check that stops matching needs an alert too.
Documentation and ownership matter as much as alerts. Each pipeline needs a named owner and a runbook for common failures. Precisely’s 2026 data integrity study found that 71% of organizations with a data strategy and governance program report high trust in their data, compared to 50% without one.
Ownership often extends into wider data management work, such as access policies and data definitions. The integration project is the natural place to start it.
The Lost & Found Marketing platform includes a reusable framework for onboarding new CRM systems. New sources join without a platform redesign, which matters for an agency that adds clients over time.
Step 7 is done when every pipeline has a named owner and written documentation. The alerts must be live as well.
Data Integration Process Checklist
The checklist below condenses all seven steps into one view. Teams can copy it into a project plan and mark each deliverable as it lands. The owner column names who signs off, not who does all the work.
|
Step |
Deliverable |
Owner |
|---|---|---|
|
Define Scope |
One-page scope with questions and metrics |
Sponsor |
|
Profile Sources |
Source inventory and profiling summary |
Data engineer |
|
Map Fields |
Signed-off source-to-target mapping |
Analyst and sponsor |
|
Choose Method |
Method and tool decision per source |
Data engineer |
|
Build and Test |
Pipelines passing reconciliation |
Data engineer |
|
Launch |
Sponsor sign-off after parallel run |
Sponsor |
|
Monitor |
Alerts, documentation, named owners |
Pipeline owner |
How Long a Data Integration Project Takes
A data integration project takes as long as its sources are messy. The number of systems matters, but the condition of the data matters more. Two well-documented SaaS tools connect much faster than a legacy database with undocumented fields or a source that needs real-time updates.
Custom logic adds the most time. Every business rule in the mapping has to be built and then tested. Disputes about definitions, such as what counts as a qualified lead, can stall a project longer than any technical problem.
Data Prism’s service page lists what clients get in the first 30 days of a project. The list starts with a source system inventory, an architecture diagram, and a build versus buy recommendation. It ends with the first two or three production pipelines, each with data quality checks.
Who Should Be Involved
A data integration project needs a small team with clear roles. The business side owns the questions and definitions. The technical side owns the pipelines. A missing business role stalls a project as surely as a missing engineer, so the sponsor and analyst deserve as much planning as the build.
|
Role |
What They Do |
When They’re Needed |
|---|---|---|
|
Sponsor |
Owns the outcome and settles definition disputes |
Steps 1, 3, and 6 |
|
Business Analyst |
Writes the questions and checks the numbers |
Steps 1, 3, and 6 |
|
System Owners |
Grants access and explains their data |
Steps 2 and 3 |
|
Data Engineer |
Builds, tests, and monitors pipelines |
Steps 2 to 7 |
|
Security or IT Lead |
Approves access and hosting |
Before Step 1 and Step 4 |
Small companies often combine roles. A founder can act as sponsor and analyst, and an outside engineer can cover the build and monitoring.
What a Data Integration Project Costs
Cost depends mainly on the number of sources and how complex they are. A few common SaaS sources with ready connectors cost far less than custom connectors for legacy systems. Ongoing costs start with tool licenses and cloud compute. Fixing pipelines when sources change adds engineering time.
Data Prism publishes starting prices for three engagement types. An integration audit starts at $1,000, a fixed-scope project at $5,000, and managed integration at $2,000 a month. The final number depends on the sources involved.
A rough figure before any call is available from a free cost estimator. It helps when internal approval needs a budget range.
Where Data Integration Projects Go Wrong
Data integration projects often fail on definitions and ownership, not on connectors. A team builds pipelines before the business agrees what a “customer” or “active account” means. The dashboard launches, and two departments see different numbers. Trust drops quickly after that.
Skipping profiling is the second common failure, because cleanup work then appears halfway through the build. Launching without monitoring is the third. The pipelines work on day one, then break quietly when a source changes. A guide to common integration challenges shows the same patterns, even when every connector works.
When You Don’t Need All Seven Steps
The full process is overkill for a simple connection between two tools. Sending new form leads into a CRM, or copying paid invoices into a spreadsheet, rarely needs a mapping document or a warehouse. A native connector or a no-code automation handles the job without a full project.
Integrating data from multiple sources earns the full process once three conditions appear together.
- Several sources feed one report.
- The numbers drive money decisions.
- More than one team reads the result.
At that point, skipping the steps costs more than following them.

Plan the First Step Before the First Pipeline
Everything above starts with a clear scope and an honest look at the sources. Every data integration process begins there. Most teams find the gaps in both during the first conversation, well before any code. Data Prism’s engineers scope a realistic first release with teams on a free 30-minute call.
Book a Free 30-Minute Meeting
Discover how our services can support your goals — no strings attached. Schedule your free 30-minute consultation today and let's explore the possibilities.
Book a Free Call

