


Introduction
Understand How Snowflake Pricing Works
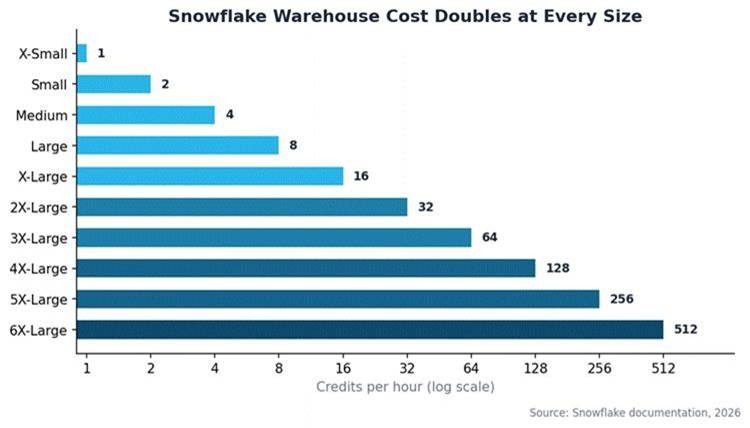
Compute is measured in credits. An X-Small warehouse uses 1 credit per hour, and a 6X-Large warehouse uses 512 credits per hour. The cost of each credit depends on your Snowflake edition. On AWS US East, it is about $2 for Standard, $3 for Enterprise, and $4 for Business Critical. Storage is charged at about $23 per compressed terabyte each month.
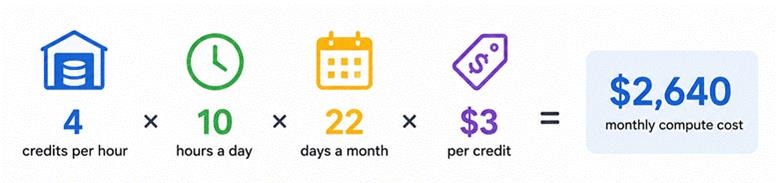
Estimating your monthly Snowflake cost is straightforward. You only need to know your warehouse size, how many hours it runs, your Snowflake edition, and your region. You can calculate the cost manually or use the Snowflake cost calculator to do the math for you.
Right-Size Every Warehouse
Each Snowflake warehouse size uses twice as many compute credits per hour as the previous size. Choosing a warehouse one size larger than needed can double the cost of running the same workload.
Test One Size Down
Larger warehouses complete queries faster, but they are only worth the extra cost if they cut runtime by more than half. A simple test is to reduce the warehouse by one size and compare the query runtime. If the queries take less than twice as long to finish, the smaller warehouse is the more cost-effective choice.

Snowflake provides two features that make it easy to test different warehouse sizes. First, you can resize a warehouse instantly without interrupting running queries, and switch back at any time. Second, the Query Profile in Snowsight shows how much data is spilled to disk. If a smaller warehouse causes heavy disk spilling, it is too small for those queries. In that case, run those large queries on a separate, larger warehouse.
Separate Workloads onto Dedicated Warehouses
Run ETL jobs, dashboards, and ad hoc queries on one warehouse and you'll size it for the heaviest of the three. A suspended warehouse burns no compute credits, so several right-sized warehouses usually cost less than one large warehouse running all day.
Handle Concurrency Spikes with Multi-Cluster Warehouses
If concurrent queries spike, use a multi-cluster warehouse instead of increasing the warehouse size. Multi-cluster warehouses require Enterprise edition. Set the minimum cluster count to 1 and choose the Economy scaling policy. Snowflake then starts extra clusters only when demand climbs, and shuts them down when demand drops.
ALTER WAREHOUSE bi_wh SET
  MIN_CLUSTER_COUNT = 1
  MAX_CLUSTER_COUNT = 3
  SCALING_POLICY = 'ECONOMY';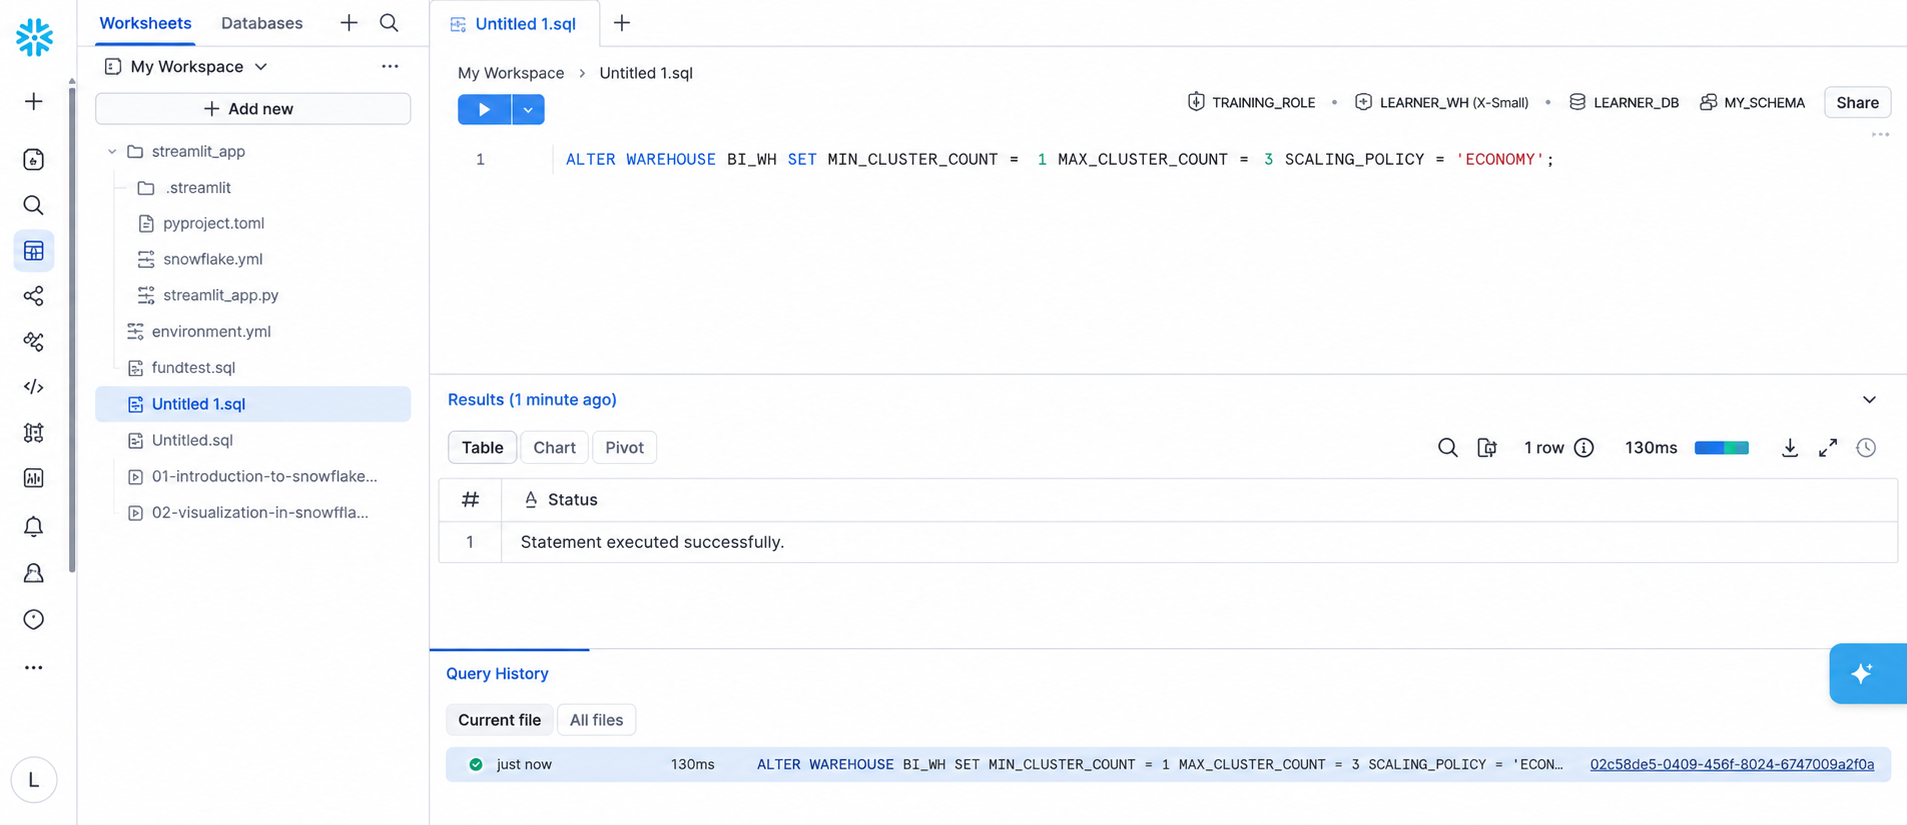
Eliminate Idle Compute
A running warehouse continues to use compute credits even when no queries are running. Snowflake charges per second, but each time a warehouse starts or resumes, there is a minimum charge of 60 seconds.
Set Auto-Suspend to 60 Seconds
To avoid paying for idle time, enable auto-suspend and set it to 60 seconds for batch and ad hoc warehouses. This automatically suspends the warehouse after one minute of inactivity and resumes it when a new query arrives.
ALTER WAREHOUSE etl_wh SET
  AUTO_SUSPEND = 60
  AUTO_RESUME = TRUE;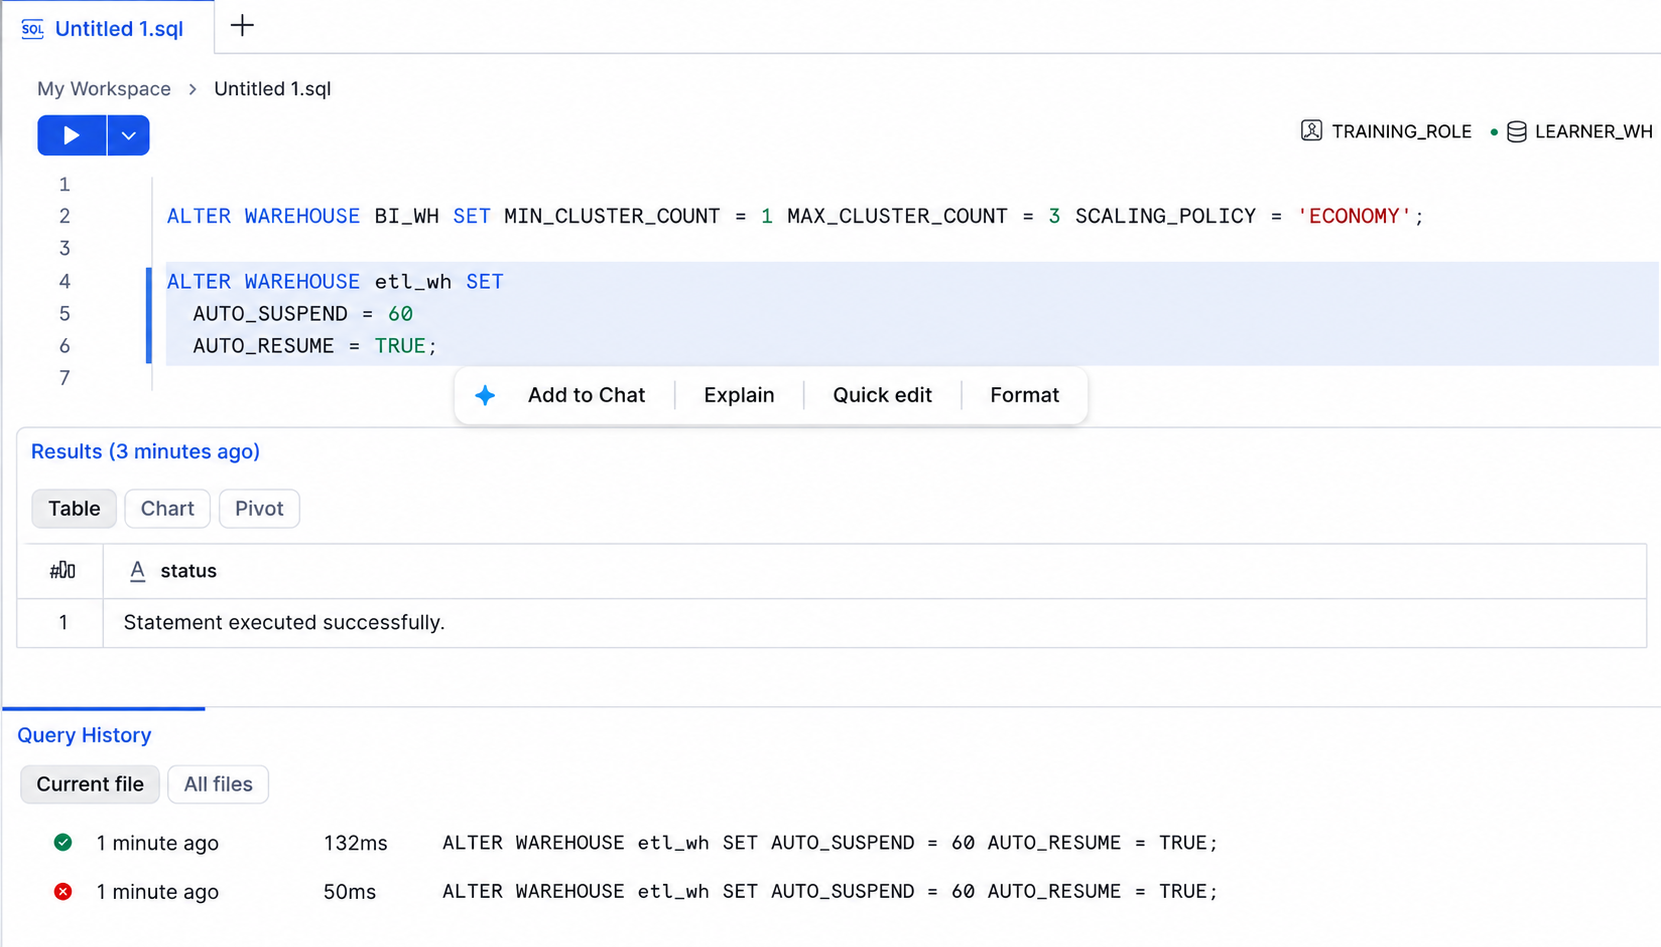
This recommendation has two exceptions.
First, when a warehouse is suspended, its local disk cache is cleared. For BI warehouses that run the same dashboard queries repeatedly, setting auto-suspend to 2 to 5 minutes can help keep the cache warm and improve query performance.
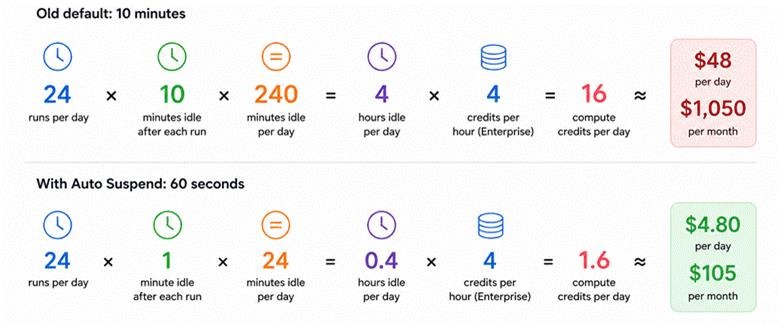 Second, that 60-second minimum applies on every resume. If a warehouse resumes frequently for short queries, the charge adds up. In these cases, a longer auto-suspend setting may be more cost-effective.
The best auto-suspend value depends on your workload. Batch jobs, dashboards, and interactive queries each have different trade-offs.

Put Hard Limits in Place
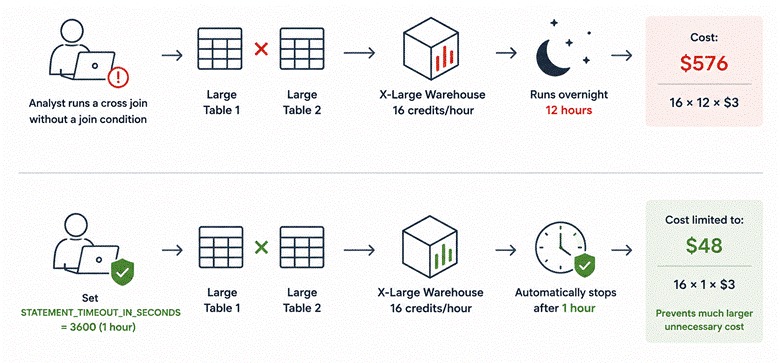
Guardrails do not optimize anything by themselves. Instead, they cap the blast radius of mistakes. Snowflake ships three of them free: statement timeouts, Resource Monitors, and Budgets.
-- Cost governance setup for adhoc warehouse
USE ROLE TRAINING_ROLE;
-- Kill any query that runs longer than an hour on this warehouse
ALTER WAREHOUSE adhoc_wh SET STATEMENT_TIMEOUT_IN_SECONDS = 3600;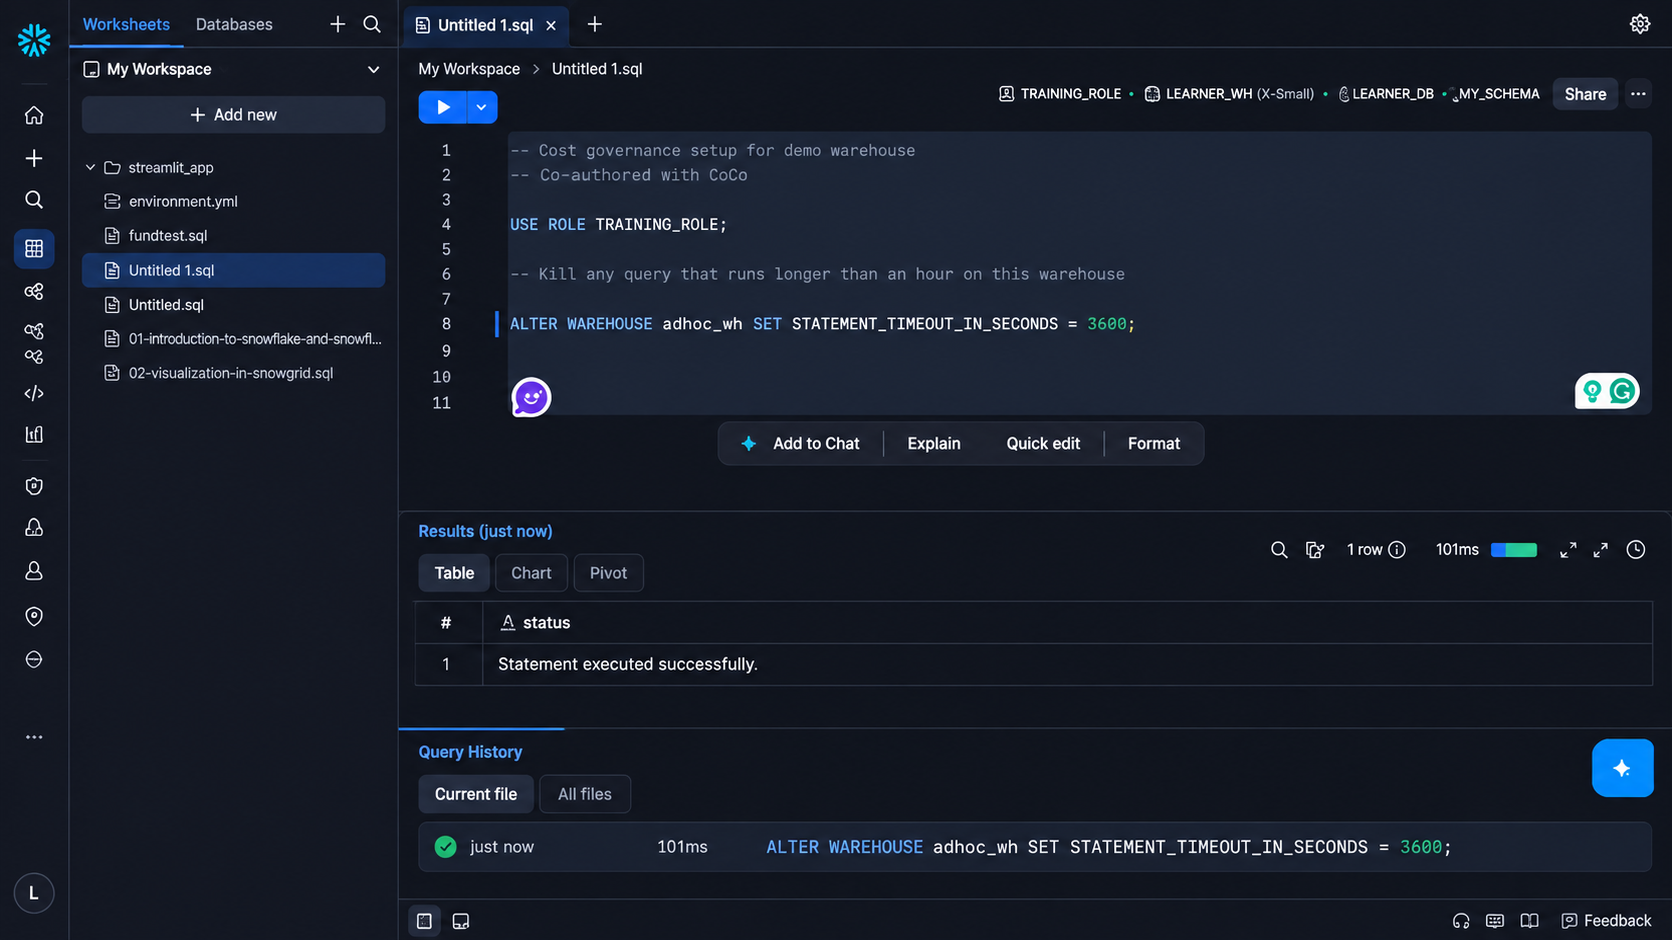
Resource Monitors and Budgets
Resource Monitors control spending for individual warehouses. They can send alerts and automatically suspend a warehouse when it reaches a specified credit limit.
Budgets, available in Snowsight, monitor spending across serverless features and even your entire Snowflake account. They notify you when projected costs are expected to exceed a spending limit but do not automatically stop workloads.
A good approach is to use Resource Monitors to enforce warehouse spending limits and Budgets to track costs for services that Resource Monitors cannot control.
Write Queries That Scan Less
Snowflake stores data in compressed, column-based micro-partitions. When you run a query, it reads only the columns and partitions needed to return the results. Compute cost depends on how much data a query scans. Scanning only the required data cuts both runtime and cost.
Select Only the Columns You Need
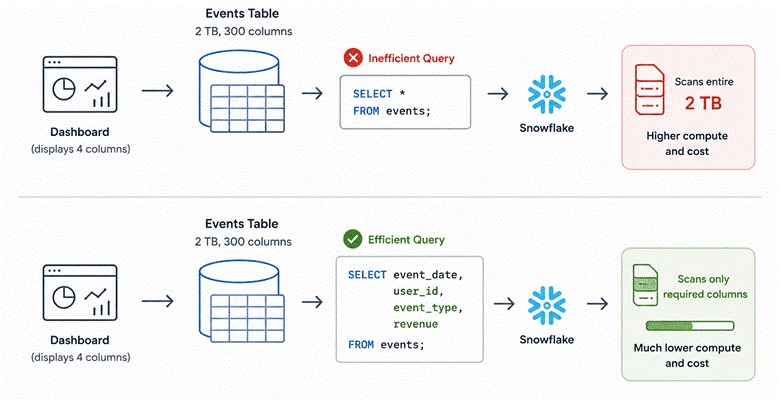
Three simple practices provide most of the benefits. The first is to select only the columns you need. Using SELECT * forces Snowflake to read every column in the table, even if your query or dashboard uses only a few of them.
Enable Partition Pruning
The second practice is to write filters that allow partition pruning. Snowflake stores minimum and maximum values for each micro-partition. When a query filters on a column, Snowflake can skip partitions that do not match the filter, reducing the amount of data it needs to scan.
For partition pruning to work, apply the filter directly to the column. Wrapping the column in a function hides its values from the optimizer, making it harder for Snowflake to skip unnecessary partitions.
-- Prunes: reads only partitions covering June
WHERE event_date BETWEEN '2026-06-01' AND '2026-06-30'

-- Does not prune: function on the column forces a full scan

WHERE TO_CHAR(event_date, 'YYYY-MM') = '2026-06'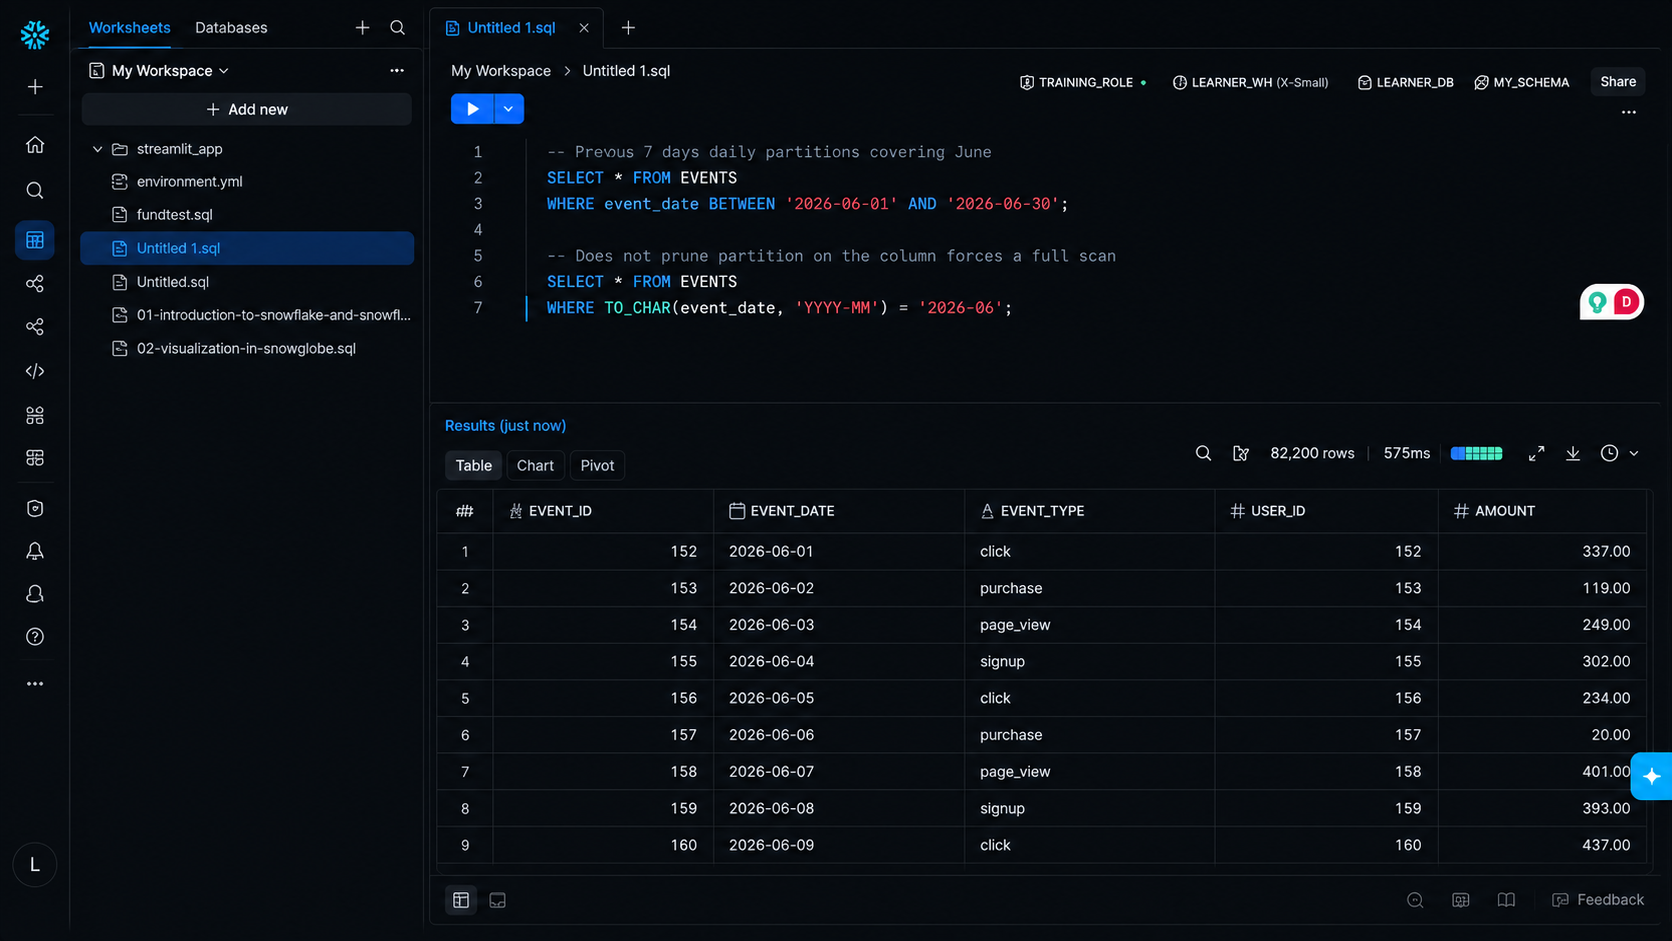
Reduce Data Early and Avoid Disk Spilling
The third practice is to reduce data as early as possible and avoid disk spilling. In the Query Profile, the metrics "bytes spilled to local storage" and "bytes spilled to remote storage" indicate that an operation ran out of memory and had to use slower disk storage.
To reduce spilling, filter and aggregate data before joining tables instead of after the join. If only a few large queries require more memory, run them on a separate, larger warehouse instead of increasing the size of a shared warehouse for all workloads.
Also, keep in mind that LIMIT 100 does not always reduce query cost. Snowflake still scans all the data needed to produce the correct results before returning the first 100 rows.
Take Advantage of the Result Cache
You should also use Snowflake’s result cache, which is free. If the same query is run again within 24 hours and the underlying data has not changed, Snowflake returns the cached result instead of running the query again. The warehouse does not even need to start, saving compute credits.
Dashboards that repeatedly run identical queries benefit from the result cache automatically. However, queries that include functions such as CURRENT_TIMESTAMP() produce different query text each time, preventing the cache from being used.
Improve Data Clustering
If most queries on a table use the same filter or sort pattern, consider defining a clustering key or sorting the data when it is loaded, such as with ORDER BY in a CTAS or COPY operation. Well-clustered data improves partition pruning, so Snowflake reads fewer micro-partitions per query.
If you use dbt for data transformations, optimizing the SQL generated by dbt can also reduce costs. Reviewing expensive queries and avoiding unnecessary model rebuilds helps lower compute usage before the workload even reaches Snowflake.
Cut Snowflake Storage Costs with Retention Features
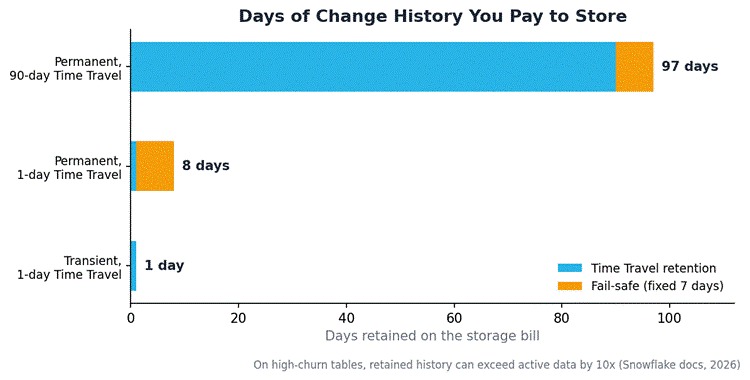
Snowflake storage costs about $23 per TB each month, but storage charges can grow quickly because of Time Travel and Fail-safe, which keep previous versions of your data.
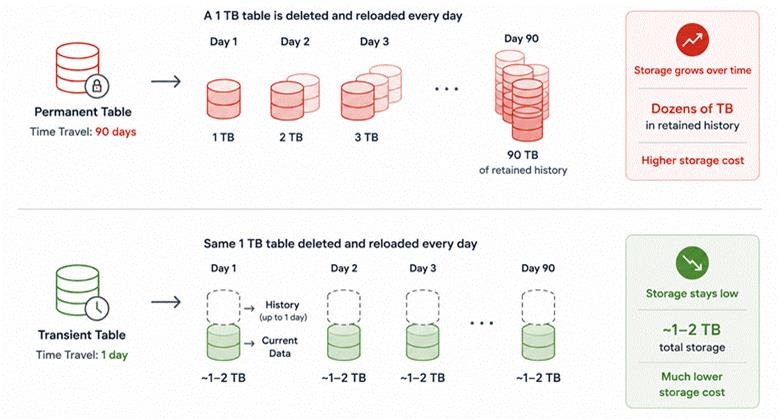
For example, Snowflake’s documentation shows that a table with 100 GB of changes every day and 90 days of Time Travel can accumulate about 9 TB of historical data. That is 10 times the size of the active data.
These storage costs are not fixed. Time Travel retention is controlled through table-level settings, so you can adjust it for individual tables based on your recovery and compliance requirements.
Configure Time Travel Retention Wisely
Set Time Travel retention based on the purpose of each table. Production tables that require point-in-time recovery can use longer retention periods. However, staging and intermediate tables usually need only 1 day of retention, which helps reduce storage costs.
Use Transient Tables for Rebuildable Data
For data that can be easily recreated, use transient tables instead of permanent tables. Transient tables do not include the fixed 7-day Fail-safe period, so they use less storage. This makes them a good choice for staging tables that are fully reloaded on a regular schedule, since keeping historical versions of that data provides little value and only increases storage costs.
USE ROLE TRAINING_ROLE;
-- Staging table: no Fail-safe, 1 day of Time Travel at most
CREATE OR REPLACE TRANSIENT TABLE stg_orders (
	order_id INT,
	customer_id INT,
	order_date DATE,
	amount DECIMAL(10,2)
)
DATA_RETENTION_TIME_IN_DAYS = 1;
-- Dial down retention on an existing table
ALTER TABLE stg_events SET DATA_RETENTION_TIME_IN_DAYS = 1;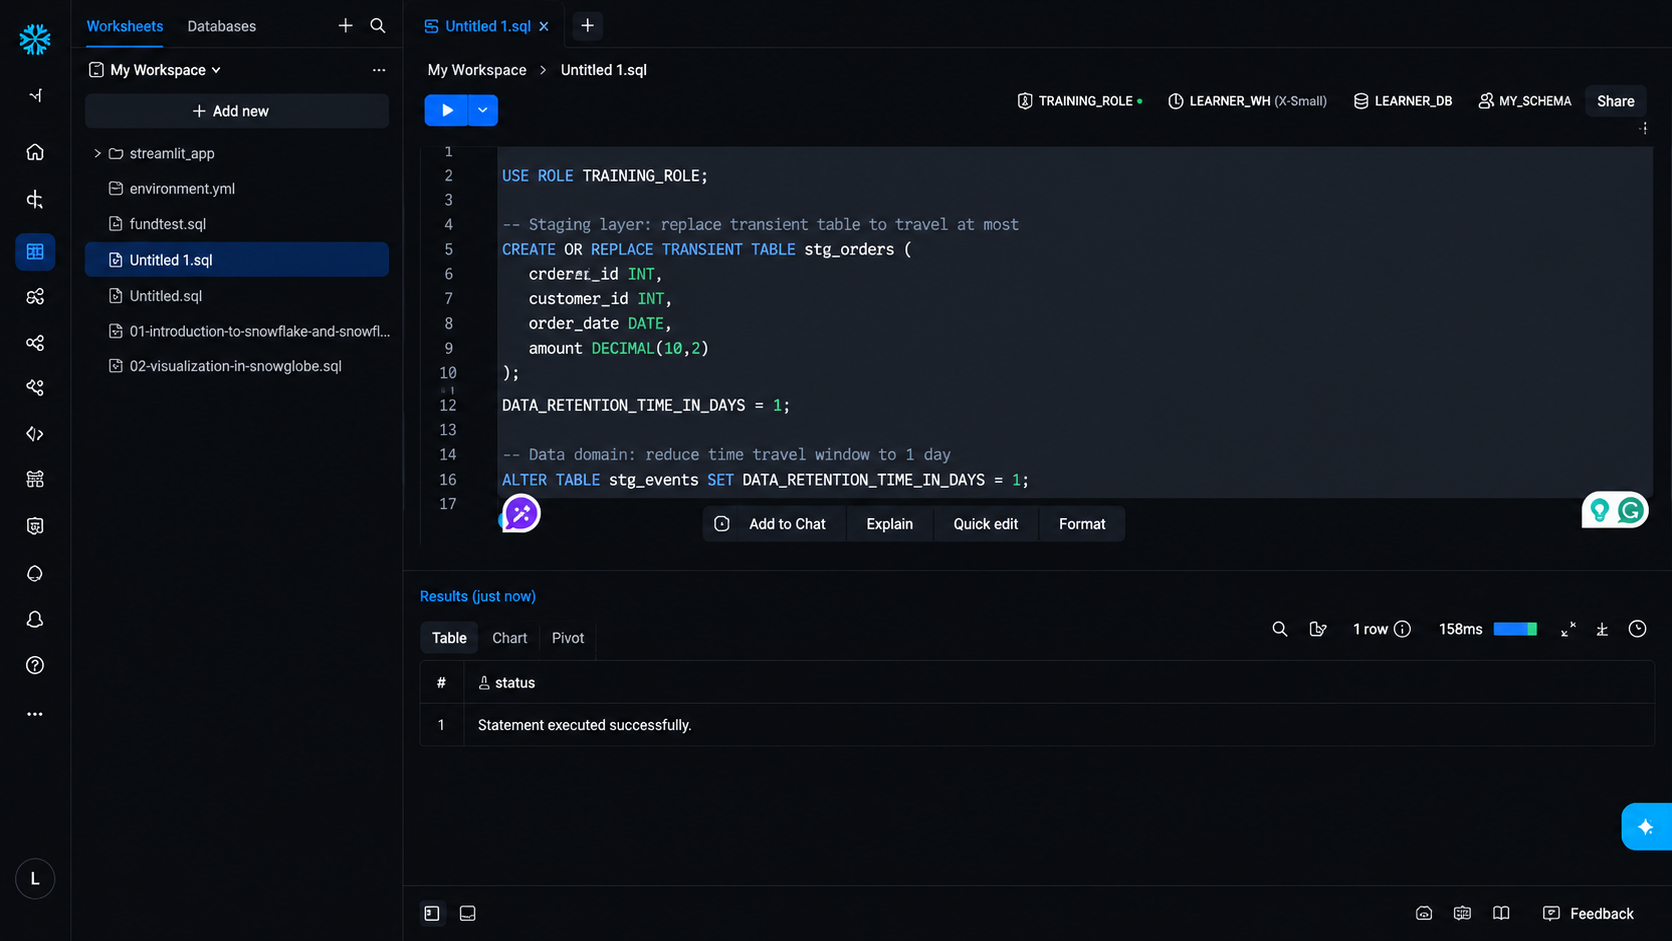
Clean Up Clones, Unused Tables, and Stage Files
Regularly review zero-copy clones and unused objects to avoid paying for unnecessary storage. A zero-copy clone does not use extra storage when it is created, but as the clone and the original table change over time, the clone starts storing its own data. An old clone that was created for testing or a migration can quietly consume terabytes of storage if it is never removed.
You can use the TABLE_STORAGE_METRICS view to identify tables using the most storage. It shows how much storage each table uses for active data, Time Travel, and Fail-safe, making it easy to find and clean up expensive objects.
 Also, remember to remove files from internal stages after they have been loaded into Snowflake. These files continue to consume storage until they are deleted with the REMOVE command.
Keep Serverless Features Honest
Some Snowflake features run in the background and use serverless compute credits. These include Snowpipe, materialized views, Search Optimization Service, Automatic Clustering, and Dynamic Tables. They are billed separately from virtual warehouses, and their cost usually depends on how often the underlying data changes.
These features involve a trade-off. They use serverless credits to reduce warehouse compute costs. They are worthwhile only if the savings from faster or fewer warehouse queries are greater than the additional serverless cost.
Use Materialized Views for Repeated Queries
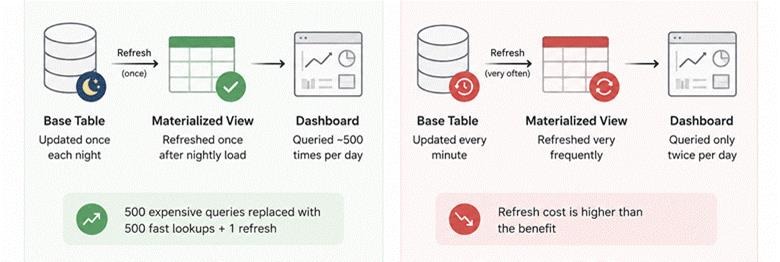
Materialized views are a good example. They automatically refresh whenever the underlying table changes. They work best when the base table is updated infrequently, but the same view is queried many times. In this case, the cost of maintaining the materialized view is often lower than repeatedly running the same expensive query.
Enable Search Optimization Selectively
The Search Optimization Service creates a special access path that speeds up selective lookups on large tables, like WHERE order_id = '12345'. You pay for that path twice, in storage and in maintenance, so enable it only on tables your queries hit with these point lookups over and over. If partition pruning alone already keeps those queries fast, skip it.
Use Automatic Clustering When It Makes Sense
Automatic Clustering keeps a table organized based on its clustering key as new data is added. It works well for tables that grow gradually because the maintenance cost is usually low. However, if a table is completely rebuilt every day, Automatic clustering can consume unnecessary serverless credits by repeatedly reorganizing the data. In that case, sorting the data during the daily load, for example with ORDER BY, provides similar query performance without the extra clustering cost.
Monitor Serverless Credit Usage
After enabling any serverless feature, monitor its usage to make sure it is providing value. Views such as SERVERLESS_TASK_HISTORY, MATERIALIZED_VIEW_REFRESH_HISTORY, and AUTOMATIC_CLUSTERING_HISTORY show how many serverless credits these features consume. Compare those costs with the warehouse credits they save to determine whether they are worth keeping enabled.
Use the Built-In Cost Visibility Features
Snowflake provides built-in tools to help you track and analyze costs. You can use the ACCOUNT_USAGE schema or the Cost Management pages in Snowsight to see where your credits are being spent.
For most cost analysis tasks, you only need three system views. These views let you identify the workloads, warehouses, and features that contribute the most to your Snowflake bill.
-- Which warehouses cost the most in the last 30 days?

SELECT warehouse_name, SUM(credits_used) AS credits
FROM snowflake.account_usage.warehouse_metering_history
WHERE start_time >= DATEADD(day, -30, CURRENT_TIMESTAMP())
GROUP BY 1 ORDER BY 2 DESC;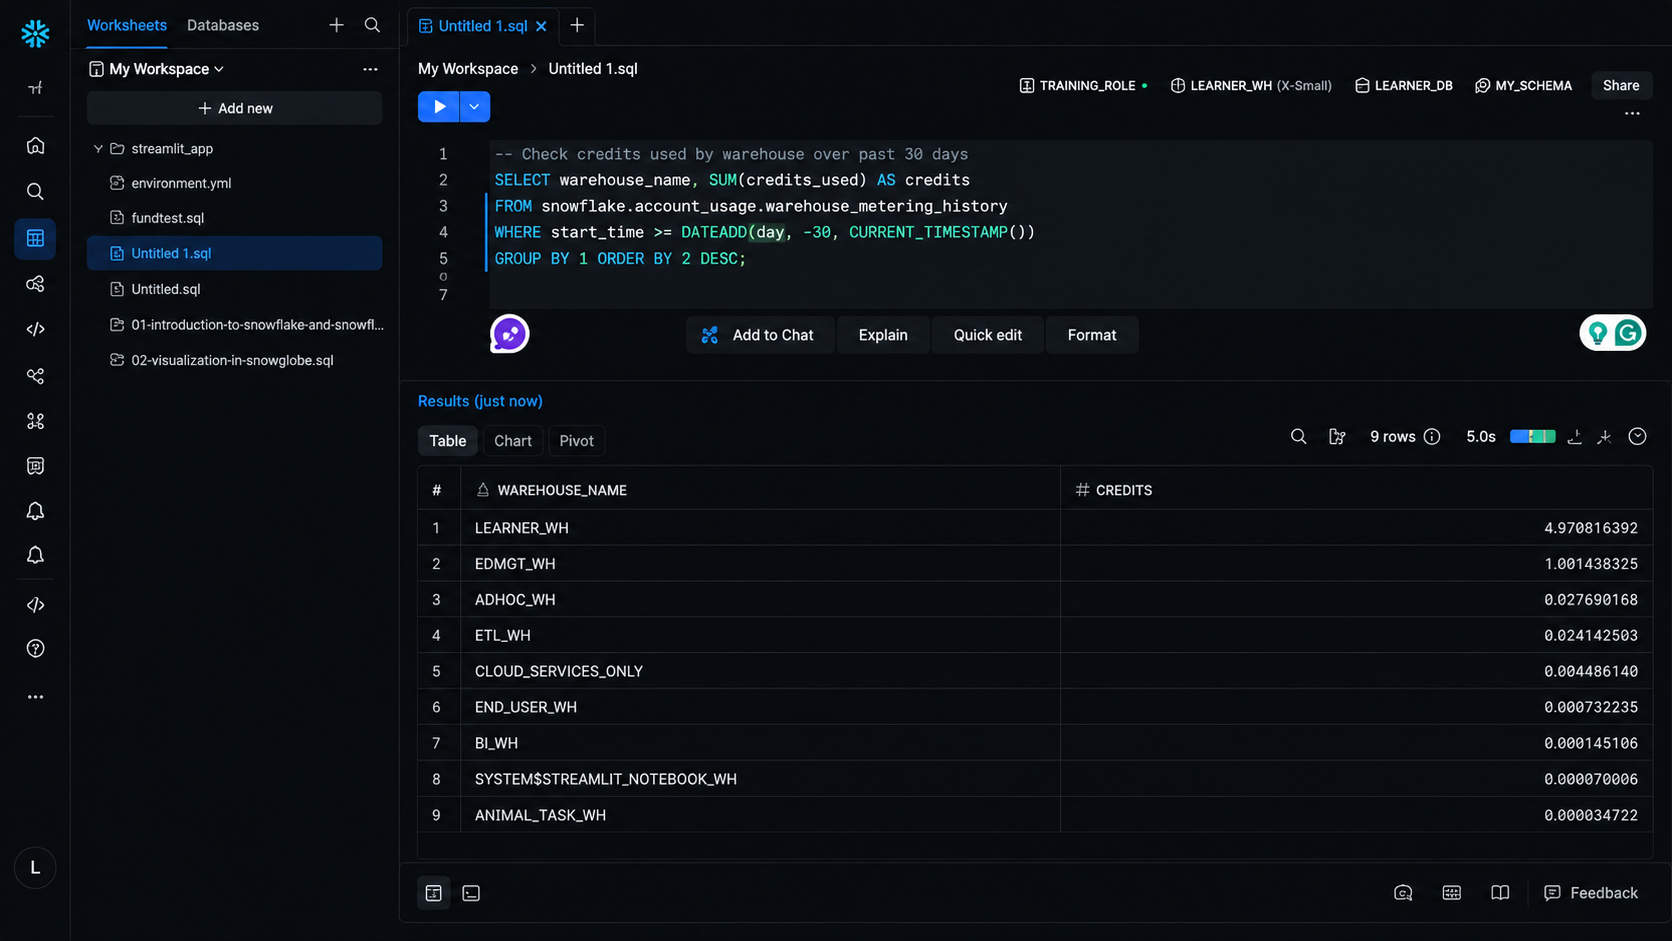
Attribute Costs to Queries and Tables
The QUERY_ATTRIBUTION_HISTORY view shows how many compute credits each query uses. Instead of knowing only that an ETL warehouse is expensive, you can identify the specific queries or dbt models responsible for most of the cost.
The TABLE_STORAGE_METRICS view provides a similar breakdown for storage. It shows how much storage each table uses, helping you find tables that consume the most space.
You can also use object tags to label warehouses, databases, and other Snowflake objects by team, department, or project. This makes it easy to group costs and create chargeback or cost allocation reports without using third-party tools.
Pay Less for the Same Credits
Technique Cheat Sheet
Where to Start
Book a Free 30-Minute Meeting
Discover how our services can support your goals — no strings attached. Schedule your free 30-minute consultation today and let's explore the possibilities.
Book a Free Call