Introduction
In 2022, Unity Technologies told investors a bad data problem would cost the company roughly $110 million in lost revenue for the year.
The company's pipelines didn't fail. Instead, its ad-targeting tool, Audience Pinpointer, kept running and producing predictions. What was the problem, then? The training data feeding it had quietly picked up bad values from one large customer, and nobody caught it before it degraded the model for months.
This is the exact failure mode a passing pipeline can hide. A schema change can slip through unflagged. A null rate can quietly double overnight. Neither event shows up as a job failure. This is the catch with infrastructure monitoring that only watches whether the code ran successfully or not. It says nothing about whether the data coming out the other end can be trusted.
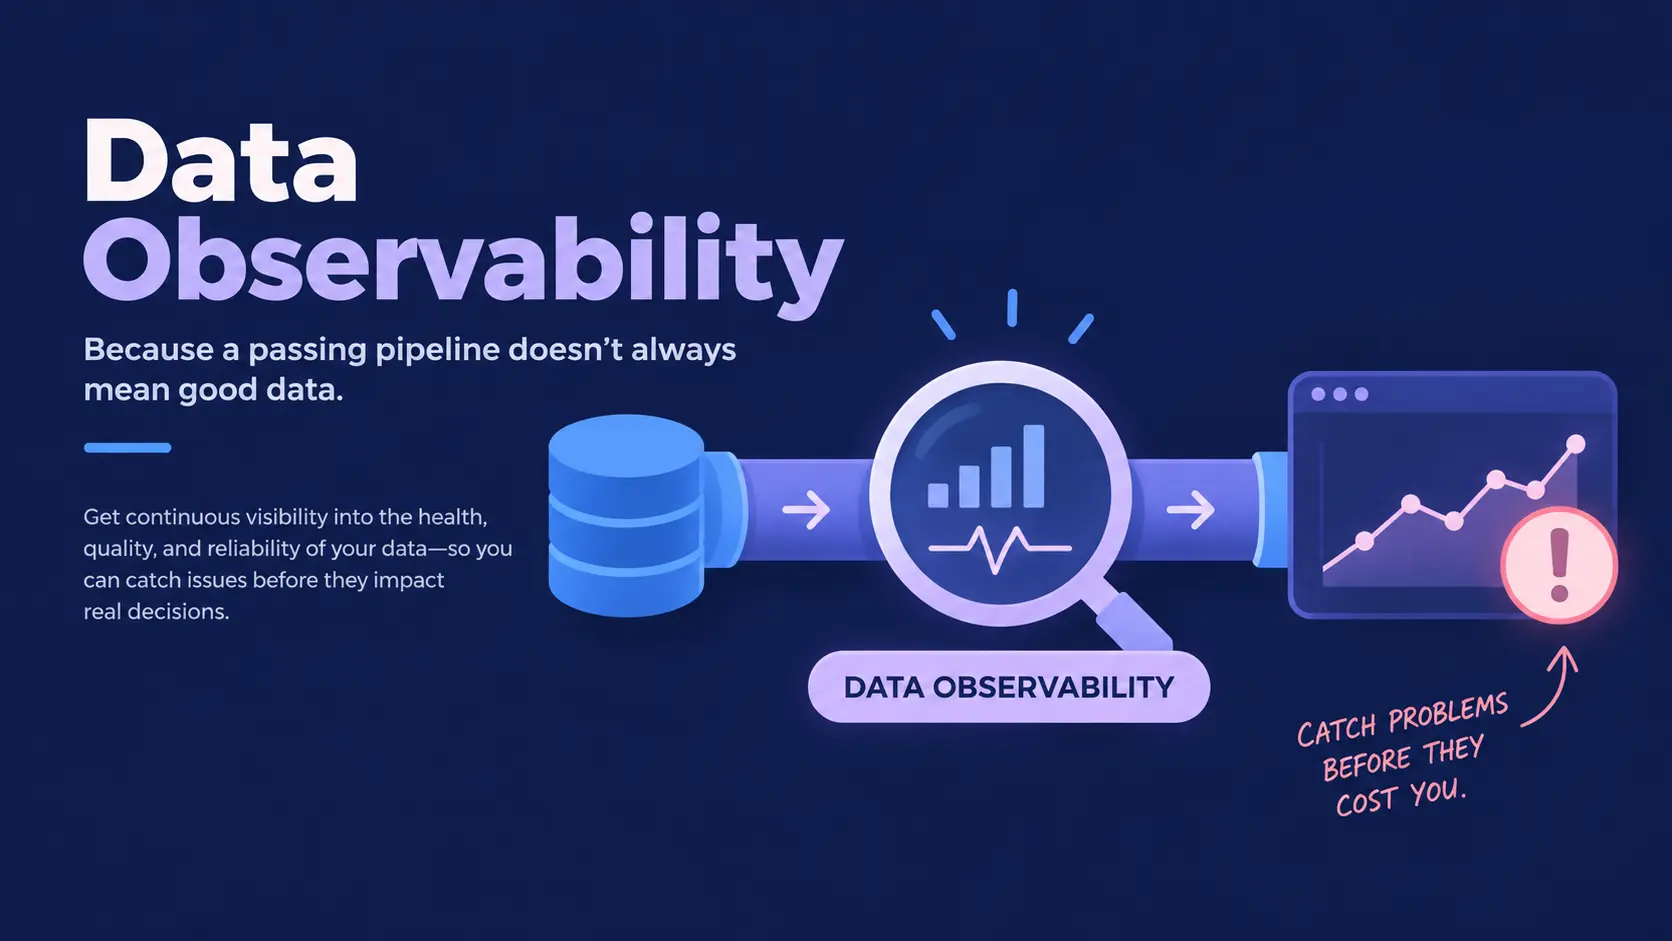
This gap is what data observability closes. It offers continuous visibility into the health of the data itself, not just the systems that move it. So, what does data observability actually add beyond a passing pipeline and a data quality test that only checks for known problems? This article answers this question and explains how data observability differs from data quality and traditional monitoring, and what it takes to run well.
What is Data Observability?
Data observability is the continuous practice of monitoring the health, quality, and reliability of data, from ingestion through pipelines and storage to the dashboards and models built on top of it. The goal isn't to watch more dashboards. It's to catch a broken data asset before someone downstream builds a decision on it.
Data observability is also the practice of monitoring, managing, and maintaining data so its quality, availability, and reliability hold up across every system it touches. The sharper line: traditional monitoring tells you a problem exists; observability tells you what caused it.
Data engineers, analytics engineers, platform teams, and increasingly AI teams all lean on it for the same reason. Their pipelines have grown too distributed for anyone to eyeball a table and know if it looks right.
Most platforms in this space build around a common set of signals, even when they group and name them differently. The table below lays out what those signals typically cover.
Data Observability at a Glance
|
Area |
What It Helps Monitor |
|---|---|
|
Freshness |
Whether expected data arrives on time |
|
Volume |
Unexpected jumps or drops in record counts |
|
Schema |
Changes to columns, types, or table structure |
|
Distribution |
Shifts in the statistical shape of values |
|
Quality |
Missing, invalid, or duplicated records |
|
Lineage |
Where data came from and what depends on it |
|
Pipelines |
Failed, delayed, or abnormal job runs |
|
Incidents |
Detection, triage, and root-cause analysis |
NOTE: Not every platform treats these eight areas the same way. Some fold quality and distribution into a single signal instead of two.
Data Observability vs Observability Data
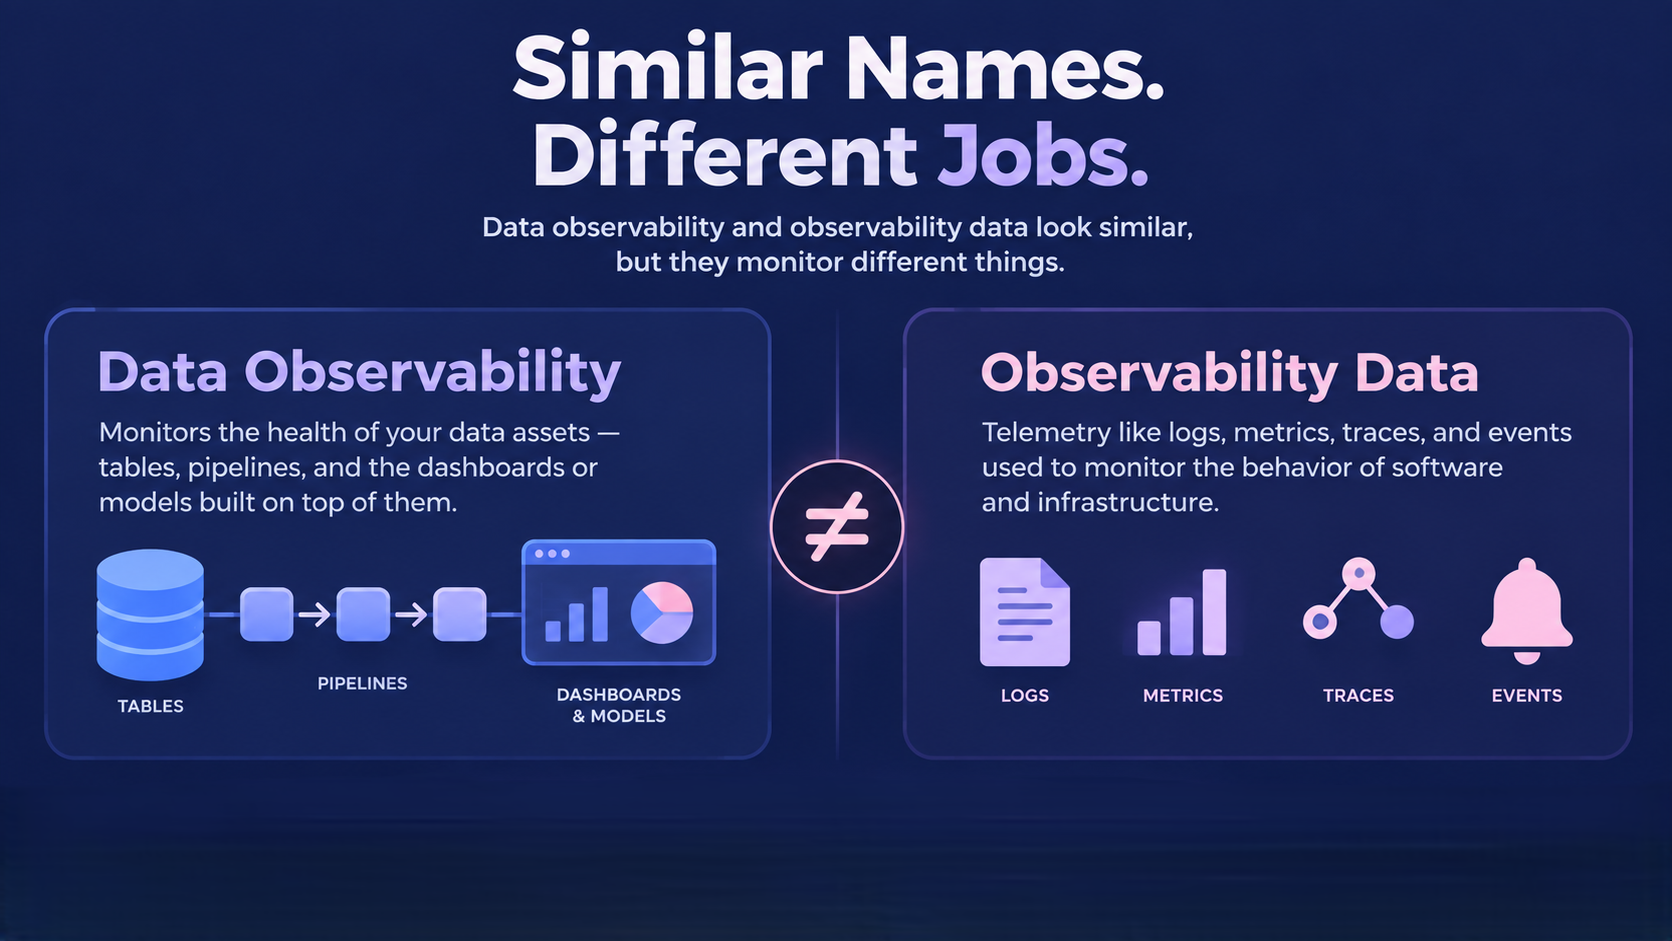
The keyword search intent here matters more than it looks. Data observability and observability data are related terms, and they point to two different jobs.
Data observability watches the health of data assets: tables, pipelines, and the dashboards or models built on top of them. Observability data is something else. Observability data is telemetry: logs, metrics, traces, and events. Engineering and security teams collect it to watch the behavior of software and infrastructure.
A site reliability team routing that telemetry through an observability pipeline works with observability data. A data engineering team watching whether a revenue table updated on schedule works with data observability instead.
The two disciplines share a root idea you can't fix what you can't see. Even so, they watch different layers of the stack, and they usually sit with different teams. The two markets serve different buyers on different timeframes, even though the names get used interchangeably in casual conversation.
Why Does Data Observability Matter?
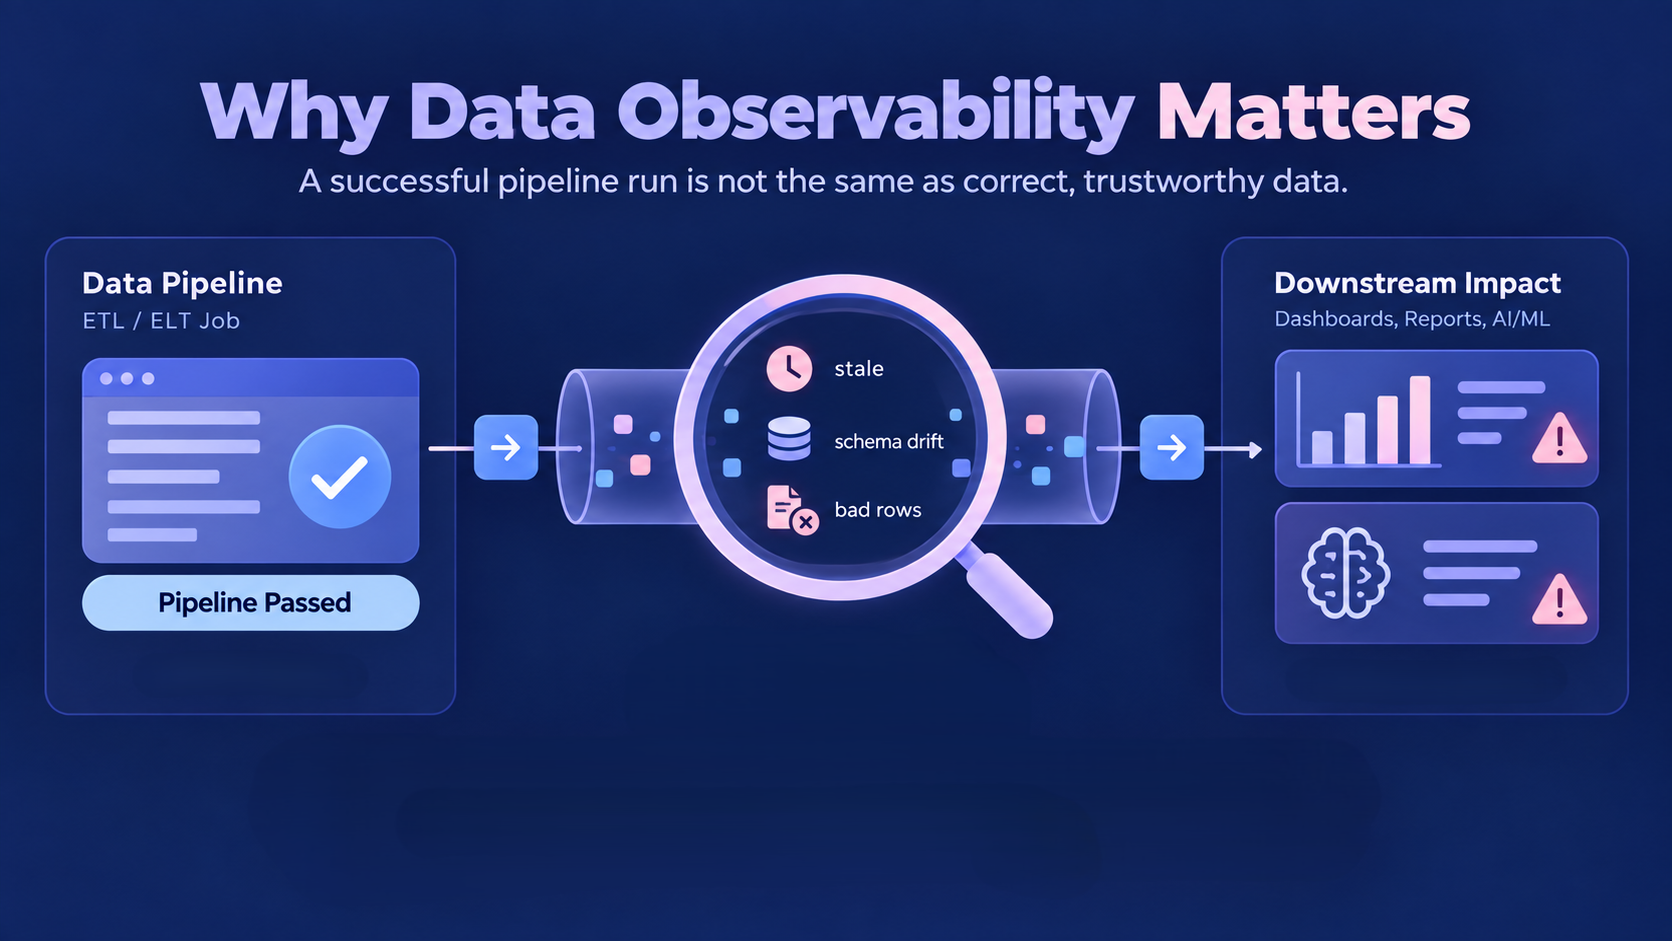
A successfully completed pipeline run and a correct dataset are not the same thing. This gap is where most of the damage happens. A job can finish on time, write to the target table, and exit with a clean status code. Underneath, it can still pass through stale values, a drifted schema, or malformed rows.
The cost shows up downstream, not at the point of failure. An executive dashboard reports the wrong revenue number. A recommendation model trains on features that stopped updating three days ago. An analyst spends an afternoon tracing a broken number back through five transformations before finding the source. None of these incidents triggered an alert, because the pipeline did exactly what it was told to do.
Data observability exists to catch the difference between a job that ran successfully and the data that is actually right. It asks a broader question than a pass-or-fail test. It tracks what changed and when. It also tracks where the change started and who needs to know before it reaches a decision.
How Data Observability Works
A typical flow runs from data sources through ingestion, transformation, and storage. From there, data reaches the dashboards and models that consume it. Observability sits across every stage of that flow instead of getting bolted onto the end.
Platforms collect metadata, query history, schema information, table statistics, and lineage from the systems already in the stack. They use that metadata to build a baseline for what normal looks like. Once a baseline exists, the platform can flag a deviation automatically. Nobody has to write a rule for it in advance.
For example, a table that usually gets 40,000 new rows a day and suddenly gets 4,000 triggers a volume anomaly on its own. The same logic applies to freshness, schema, and distribution.
Detection is only half the job. The other half is context. A useful platform shows which downstream tables, dashboards, and models depend on the broken asset. It also shows who owns the fix. This context turns an anomaly into an actionable incident, not another entry in a log nobody reads.
Data Observability vs Data Quality
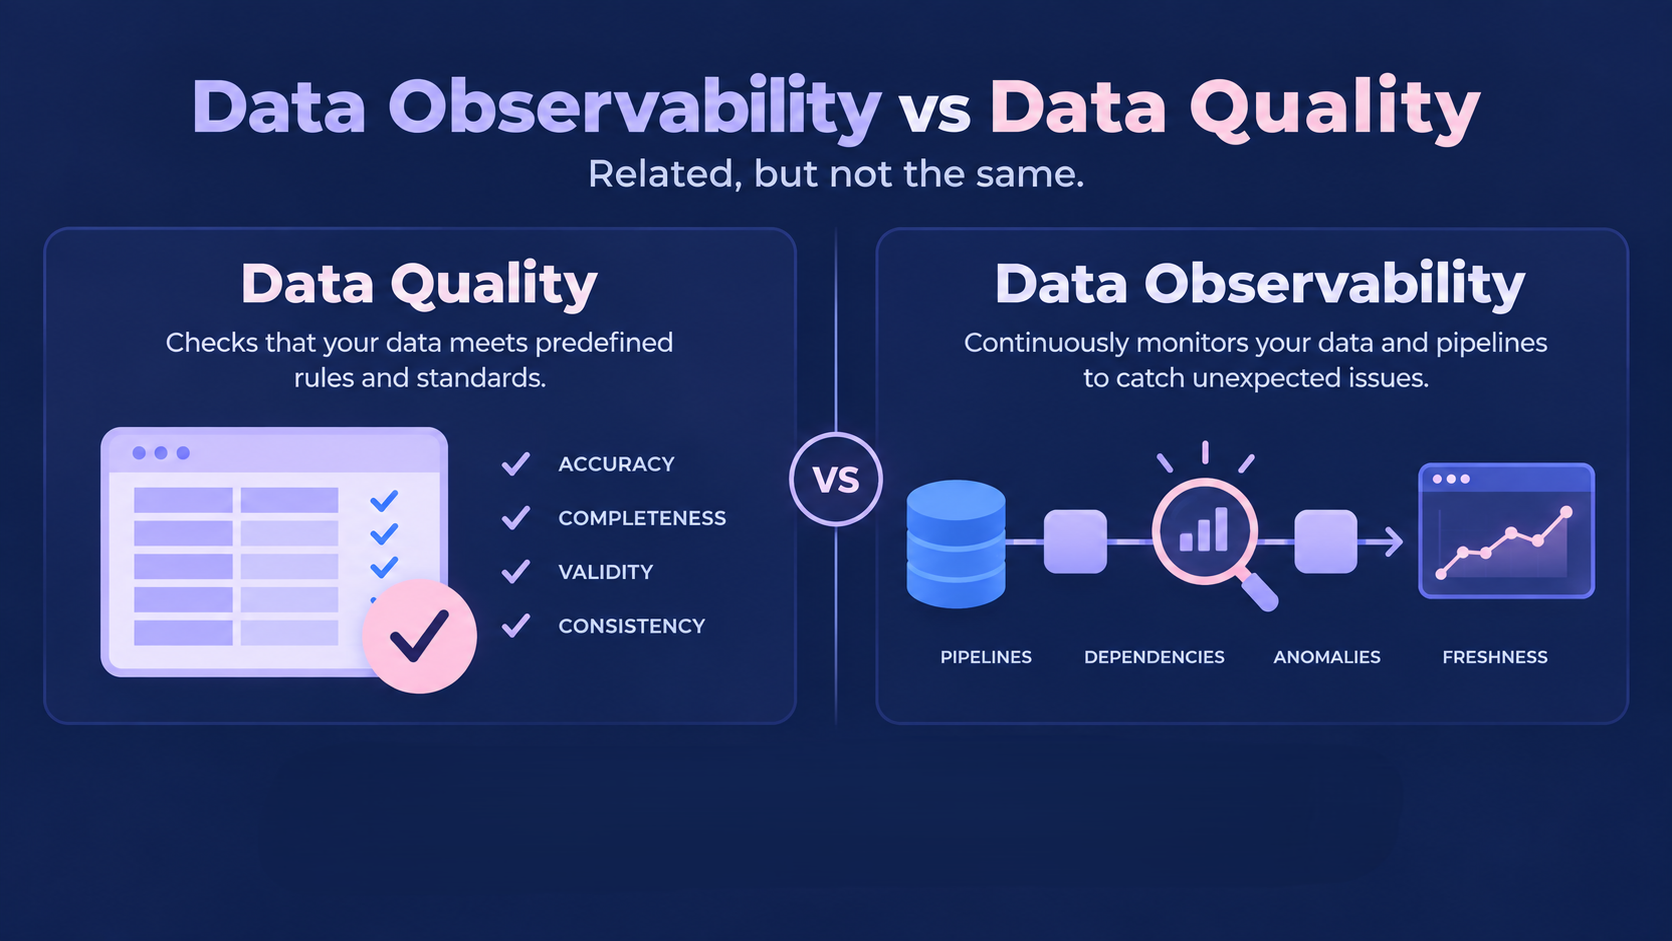
These two disciplines get treated as synonyms more often than they should be. Data quality is about how well data meets the standards an organization has already defined. Data observability is about monitoring and maintaining those standards continuously, catching the anomalies nobody wrote a rule for yet.
Data quality focuses on the content of the data itself, things like accuracy and completeness. Data observability focuses on the systems and pipelines that move and produce that data. A pipeline can pass every quality check on a table and still hide a freshness problem three tables upstream. This blind spot is exactly what observability is built to close.
|
Factor |
Data Quality |
Data Observability |
|---|---|---|
|
Primary Question |
Does this data meet our rules? |
Is anything behaving differently than usual? |
|
Detection Method |
Predefined validation rules |
Rules plus automated anomaly detection |
|
Scope |
The dataset's content |
Pipelines, dependencies, and content |
|
Lineage |
Sometimes separate |
Usually built into investigation |
|
Root Cause |
Not always covered |
A core capability |
Neither replaces the other. Most mature data teams run both, because a system that only tests known rules will always miss the failure nobody anticipated.
Data Observability vs Traditional Monitoring and Governance
Traditional infrastructure monitoring answers a narrower question than either discipline above. It tells you a job failed, a query ran slow, or a service went down. It says nothing about whether the data that job produced makes sense. A pipeline can succeed while delivering 40% fewer records than usual, and standard monitoring has no way to notice.
Governance is a different neighbor again. It includes ownership, policy, access, and compliance. This covers the rules for who can do what with which data. Collibra has built its own platform around this connection, unifying quality, observability, and governance in one place.
Observability signals make governance easier to enforce, since they show who owns an affected asset and how urgent a given incident really is. Governance decides the rules. Observability tells you when they have been broken and by how much.
Data Observability Tools
Buyers usually start by comparing feature lists. However, the more useful lens is the capability category. A production-grade platform typically covers automated anomaly detection, schema and freshness monitoring, lineage-based impact analysis, root-cause tooling, and alert routing into channels a team already watches.
Datadog's Data Observability product shows how these categories come together in practice. It bundles a data catalog, cross-platform lineage, quality monitoring, and jobs monitoring for orchestrators like Airflow and Spark into one product.
Datadog built part of this on its 2026 acquisition of Metaplane. Monte Carlo, Bigeye, Sifflet, DataHub, and Ataccama occupy the same general category. Each brings its own mix of warehouse integrations, anomaly detection approach, and governance depth.
No single feature list settles which platform fits a given team, and none of these vendors covers every category equally well. The honest comparison runs against your own failure history, and not a specifications sheet. The evaluation table below walks through what to ask instead.
How to Evaluate a Data Observability Platform?
Evaluating a platform comes down to seven questions, not a feature list. The table below breaks each one down.
|
Evaluation Area |
Question to Ask |
|---|---|
|
Coverage |
Which systems and data assets can it monitor? |
|
Detection |
Does it rely on rules, anomaly detection, or both? |
|
Lineage |
Can it trace both upstream and downstream dependencies? |
|
Diagnosis |
How much context comes with a flagged incident? |
|
Alert Design |
Can the team control routing, severity, and volume? |
|
Cost Model |
Is pricing based on assets, rows, or seats? |
|
Operational Load |
How much upkeep does the platform itself need? |
A feature-count comparison misses the question that matters most: how many of these alerts will an on-call engineer actually act on? Set thresholds deliberately for each asset instead of applying one sensitivity setting everywhere. Route each alert to the person who can actually resolve it. Coverage, detection, and lineage matter more here than any single feature.
Data Observability Use Cases
These five scenarios show the same pattern: a pipeline that succeeded and a dataset that quietly didn't.
- Stale Data Before a Reporting Cycle: A finance table that normally updates by 6 a.m. is still showing yesterday's numbers when the morning dashboard refresh runs. Freshness monitoring catches the gap before an executive opens the report.
- A Volume Anomaly Nobody Flagged: Daily signup events drop by a third overnight. Nothing in the pipeline failed. An upstream tracking change had simply stopped firing for one region.
- A Silent Schema Change: An upstream team renames a column during a routine migration. Every downstream transformation that referenced the old name either breaks loudly or, worse, silently returns nulls.
- Protecting a Revenue Dashboard: A source table changes shape three hops upstream from an executive dashboard. Lineage-based impact analysis flags every downstream asset that depends on it before anyone in finance notices the number looks wrong.
- Feeding a Retrieval System: A knowledge base that powers an internal AI assistant stops refreshing. The assistant keeps answering questions confidently, just with information that is three weeks stale.
Data Observability for AI and Machine Learning
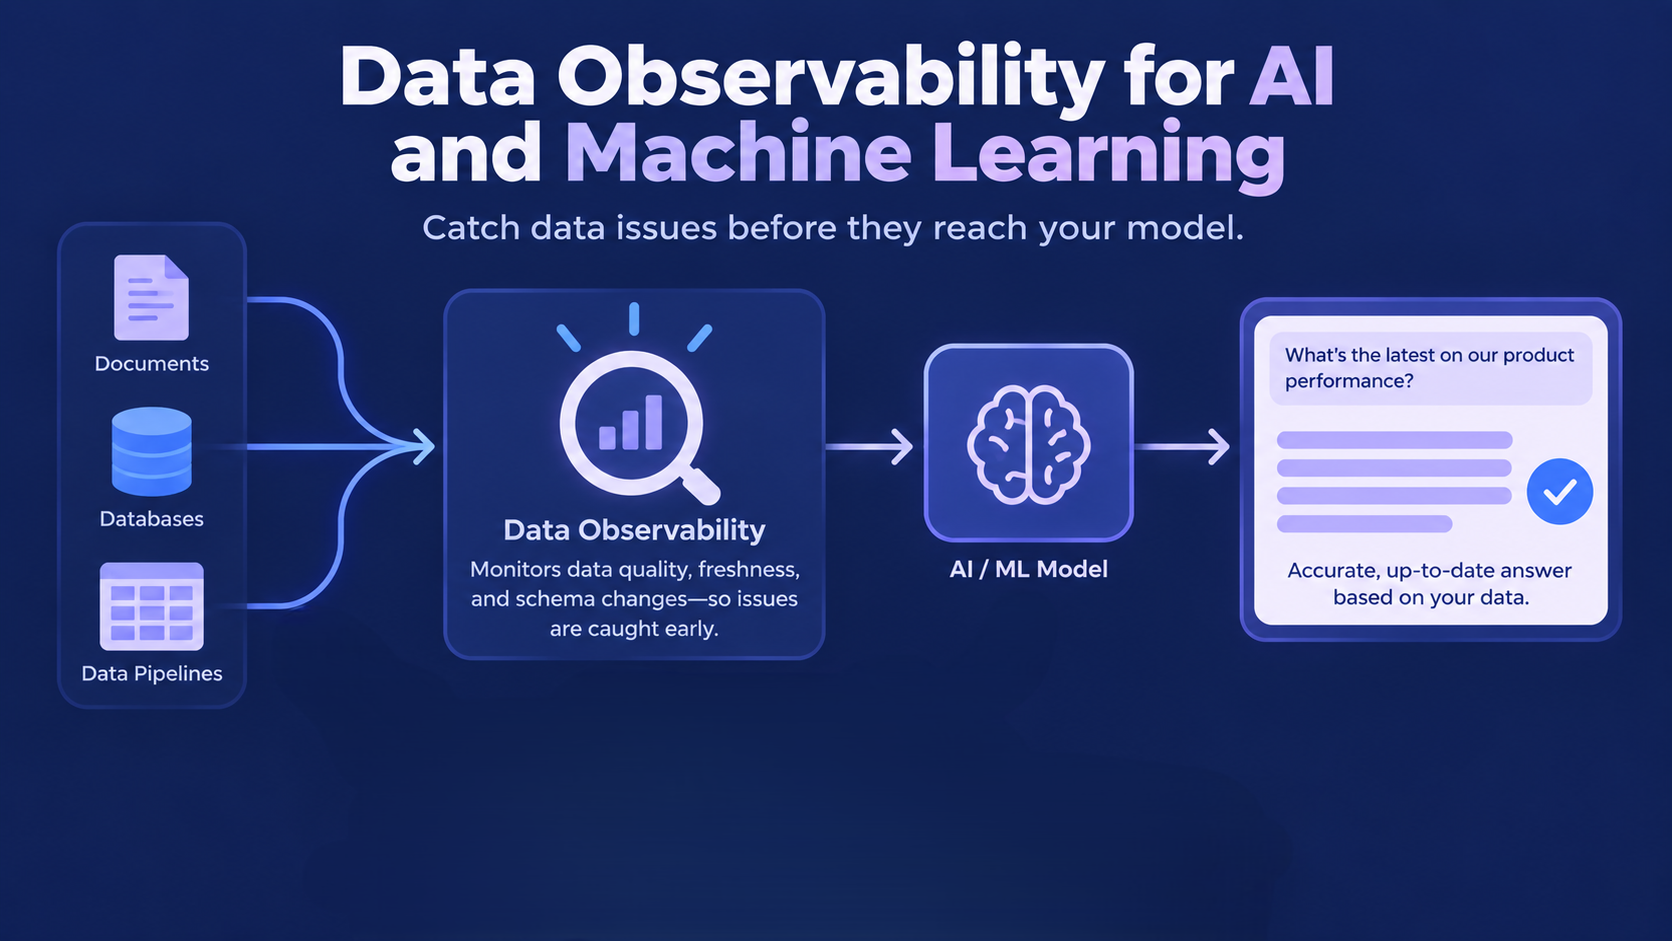
Training data, feature pipelines, and retrieval systems all inherit whatever is wrong with the data feeding them. AI systems tend to fail quietly rather than loudly when that happens. Retrieval-augmented generation grounds a model's answers in a company's own documents and databases, instead of relying only on what the model learned during training. When the underlying knowledge base goes stale, or a source table's schema shifts, the model doesn't error out. It just answers with outdated or wrong context, in the same confident tone as always.
Academic research on this exact failure mode has started catching up to the practical problem. A 2025 paper on data quality in retrieval-augmented generation systems found that most existing data quality frameworks were built for static datasets. They don't adequately cover the dynamic, multi-stage nature of a RAG pipeline, where a single freshness or schema failure upstream can quietly degrade every answer downstream.
Observability doesn't replace model evaluation or human review here. It's the layer that catches input-side failures before they reach the model. Teams building AI agents or automation on internal data often need this visibility earlier than they expect. This means it is worth factoring into any broader AI consulting and strategy work before a pipeline goes into production.
How to Implement Data Observability?
Start with the datasets that would actually hurt the business if they broke. Going for every table in the warehouse on the first attempt can cause more harm than good.
Map the pipelines and dependencies that feed those datasets. Assign a named owner to each one. Connect monitoring to the metadata sources already available, like query logs and schema history, before adding anything new. Teams still untangling scattered source systems often handle this step as part of a broader data integration project, since the same dependency map feeds both efforts.
Configure baseline rules first. Layer in anomaly detection where the failure mode is one nobody can predict in advance. Route every alert to a specific owner rather than a shared channel. Define severity levels so a stale marketing table doesn't page someone at 2 a.m. the same way a broken billing pipeline would.
Expand coverage gradually as the platform earns trust. Revisit the noisiest monitors on a schedule instead of letting them accumulate. A platform that monitors a thousand tables badly is worse than one that monitors fifty tables well, since the former trains the team to ignore its alerts.
Measuring the Business Value of Data Observability
The right comparison isn't tool cost against no tool at all. Checking the cost per prevented or resolved incident against the engineering hours that incident would otherwise consume will make more sense. A cheaper platform that generates constant false positives can cost more in analyst time than a pricier one that resolves incidents faster.
Useful operational metrics include the number of data incidents per month and the average time to detect one. Add the average time to resolve an incident, plus the share of incidents a team catches internally before a business user reports a broken dashboard first. Tracked over time, this figure is often the clearest signal that a platform is earning its cost. It shows whether the team is getting ahead of problems or still finding out about them the hard way.
Who Actually Needs a Data Observability Platform?
Data engineering and platform teams get the clearest return once pipelines and dependencies have grown too complex for anyone to track by memory. Analytics engineering teams benefit when a broken transformation can silently propagate into a dozen downstream reports. AI and machine learning teams need it once a model depends on data that changes without warning.
Small teams with a handful of stable pipelines and low-cost failures often don't need a dedicated platform yet. Solid tests inside the orchestration tool already in use can cover the same ground. However, it’s important to pair them with a clear owner for each critical table.
Observability technology also can't fix a missing owner, an undocumented pipeline, or a team with no process for triaging an incident once one is flagged. The use of these tools can amplify good practice, but it can’t replace it.
Is Data Observability Worth It?
The answer depends on how much a bad number actually costs an organization, not on whether the category is trending. A company where broken data reaches an executive dashboard, a customer-facing feature, or an automated model has a real incentive to catch that failure early.
Similarly, a company running a handful of pipelines with tolerant consumers downstream may get more value from disciplined data quality tests and a documented owner for each table.
The goal was never to monitor more things. It's to catch the failures that would have cost real money or real trust, before they reach the people making decisions on top of the data.
Conclusion
Most of the failures above don't show up until a dashboard or a customer already has the wrong number in front of them. If that sounds familiar, we're happy to look at your pipelines in a free 30-minute consultation and point out where the blind spots are.
Book a Free 30-Minute Meeting
Discover how our services can support your goals — no strings attached. Schedule your free 30-minute consultation today and let's explore the possibilities.
Book a Free Call